How can we help users turn data into action?
Company
Atom Learning
Role
Lead Designer
Area
Dashboard, Data Visualisation
Working parents across the UK have trusted Atom Learning to help their Y5-Y6 children prepare for the 11+ exam. To support them, we created a dashboard to track progress and keep their exam prep on course. But parents found the old dashboard confusing and frustrating, and it just wasn’t cutting it.
To top it off, the bounce rate (sessions without conversions) were more than 60%!
Old dashboard (1)
Old dashboard (2)
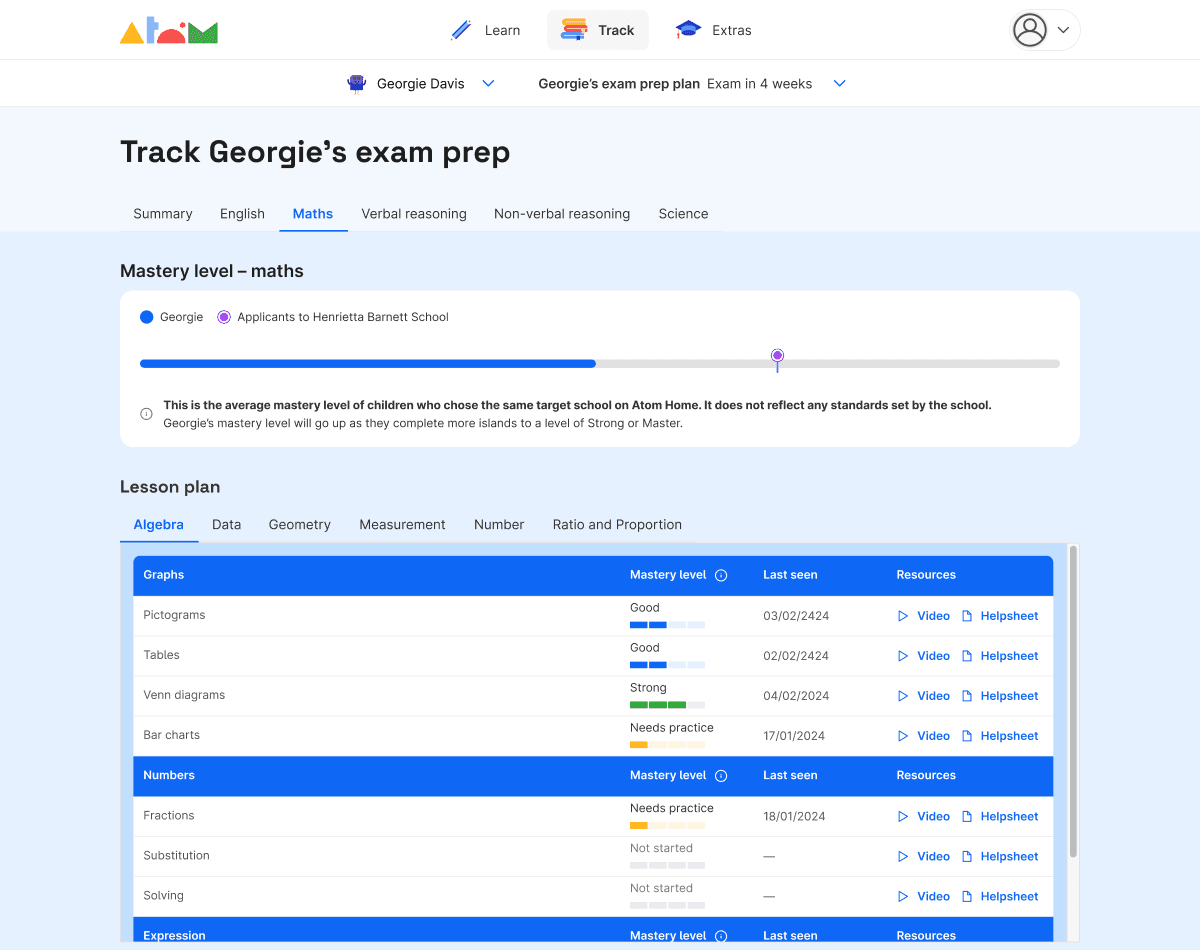
Old structure with a tab for each subject.
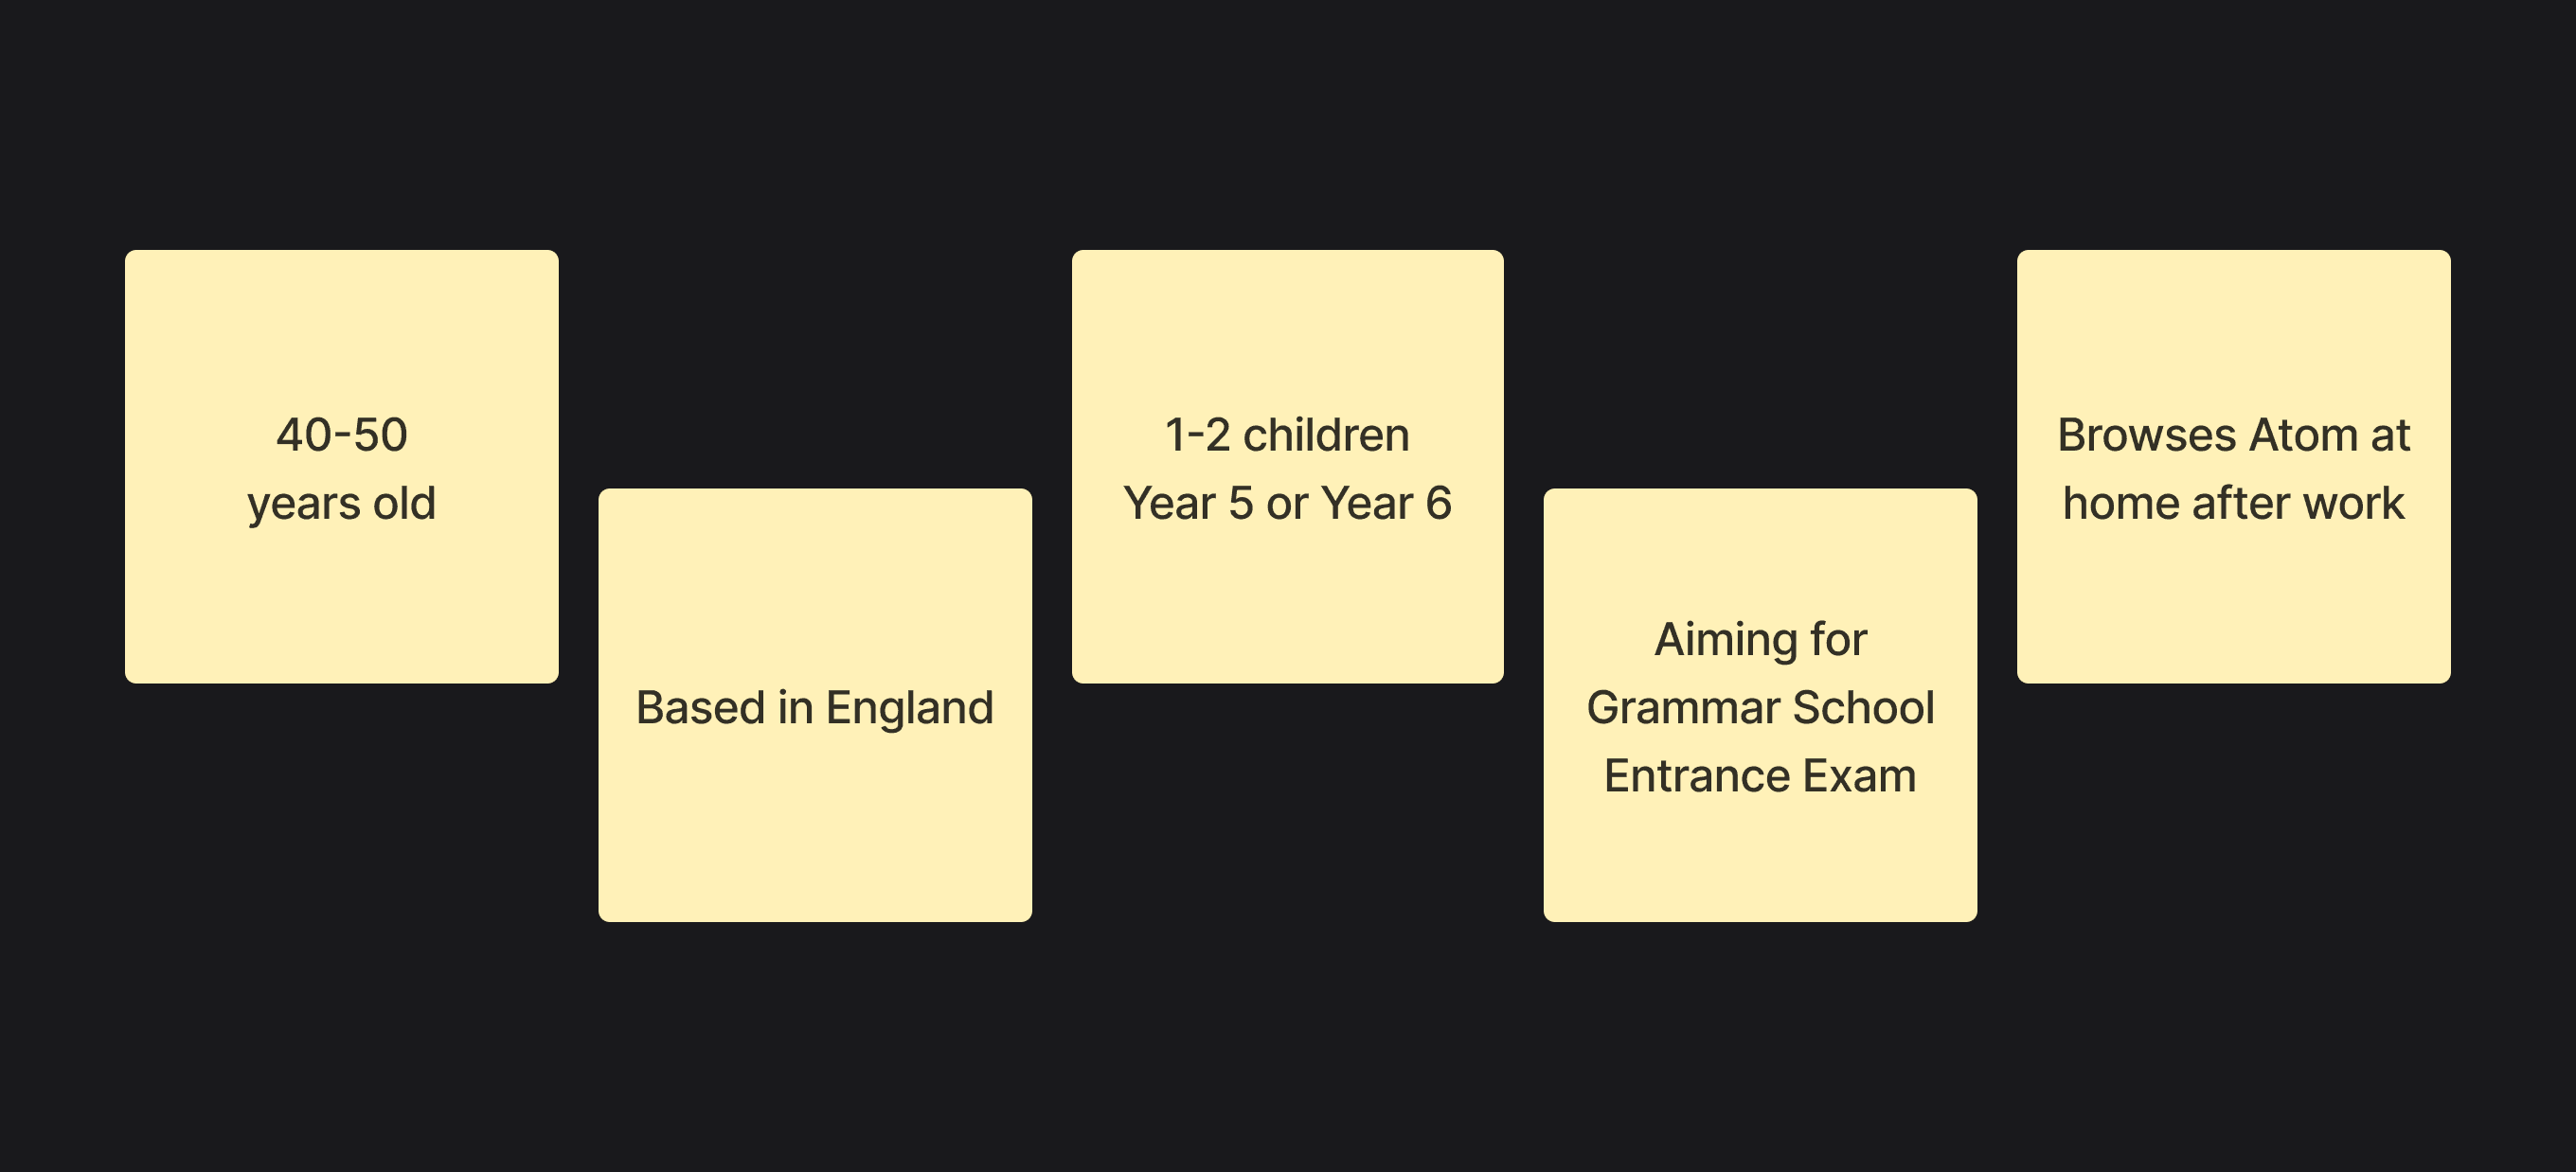
Why is this happening? To understand the issue better, I needed to talk to our users and get a sense of what needs are we not meeting there. Here's the demographic of our users.
User demographic.
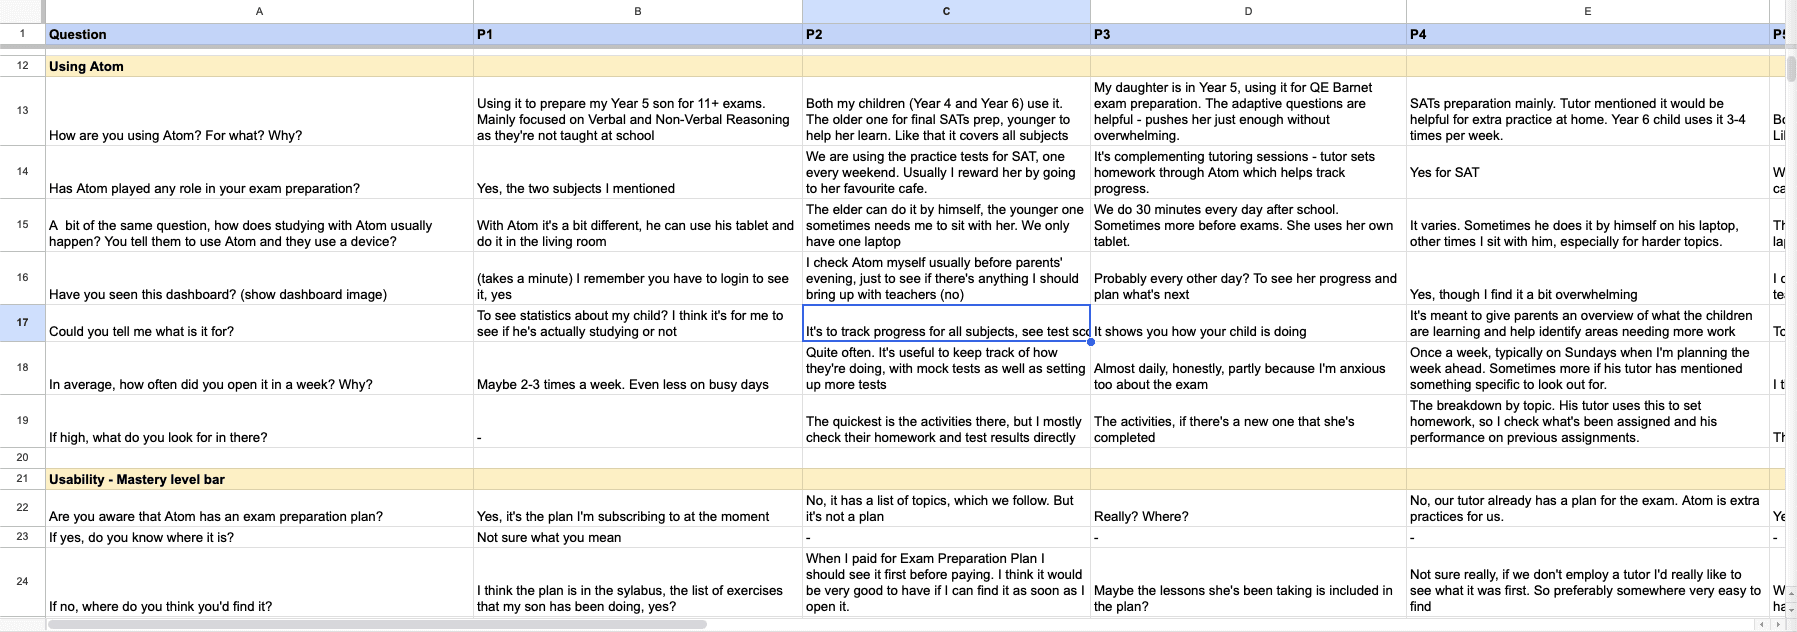
I invited 10 of them for an interview, only 5 of them showed up, knowing they're busy parents, we learned to live with it. Here's what they said below, along with the summary.
Interview responses
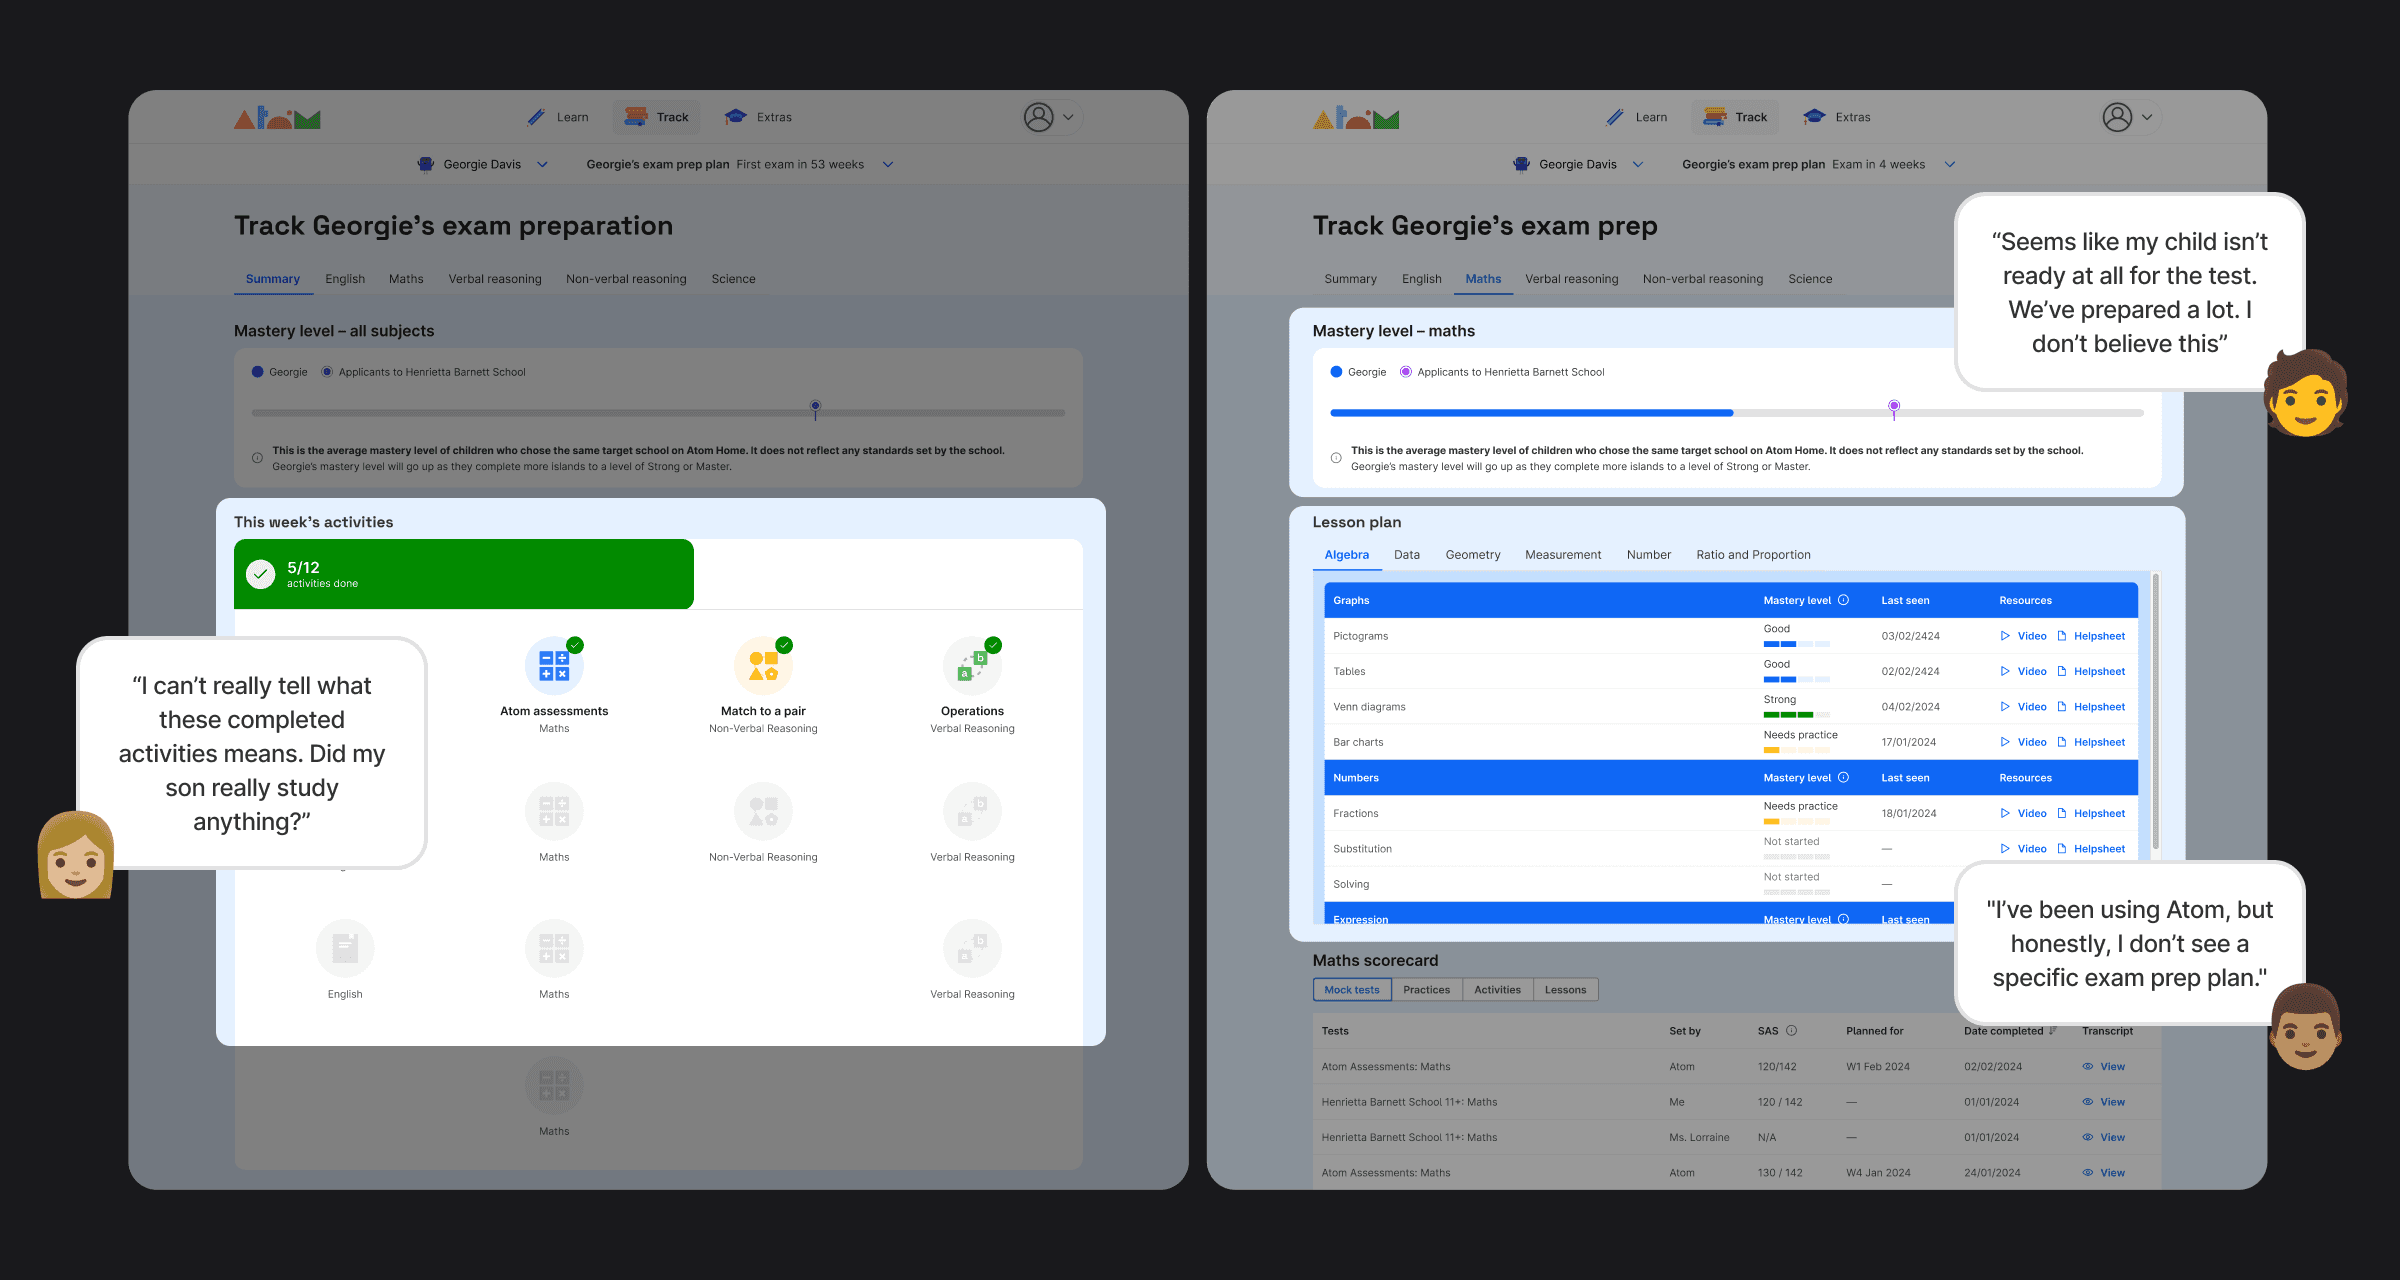
Key comments from parents.
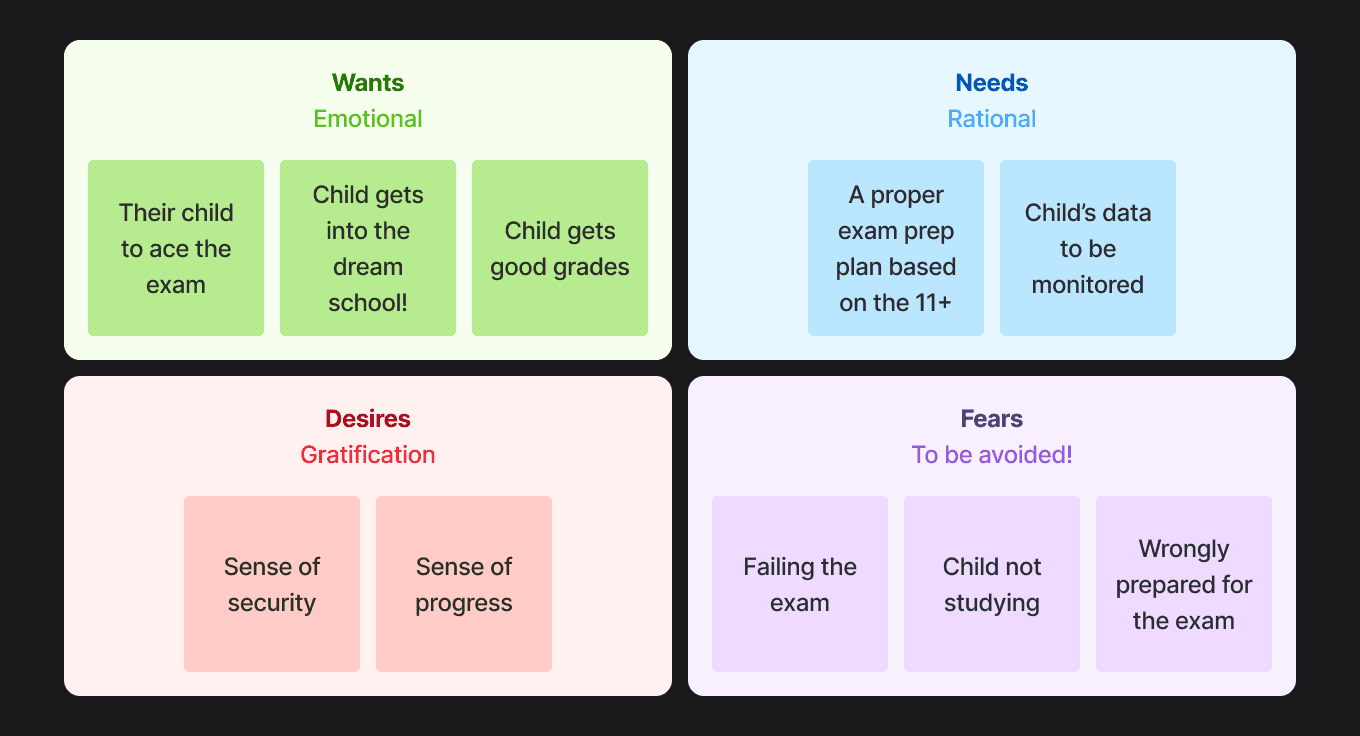
How they think, driven by their wants and fears.
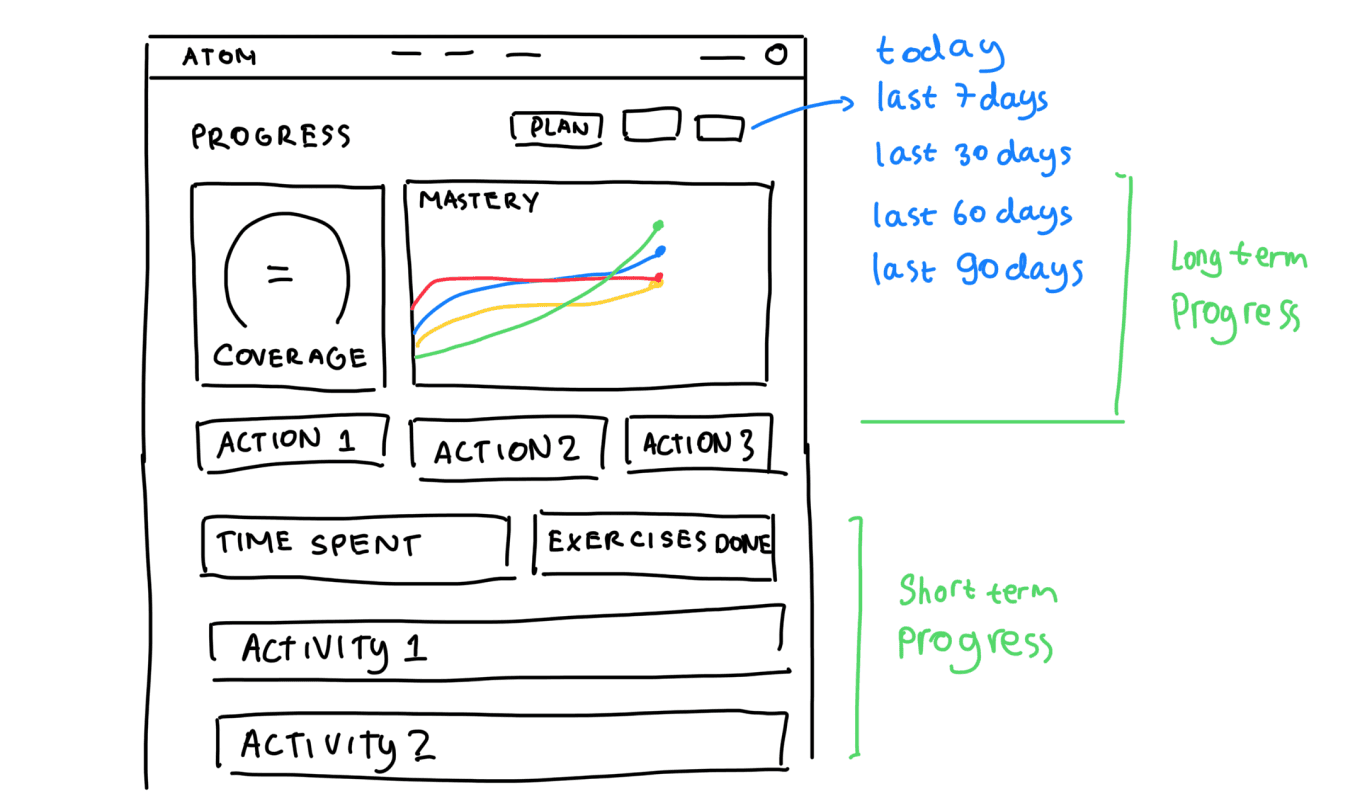
The aligned upon direction.
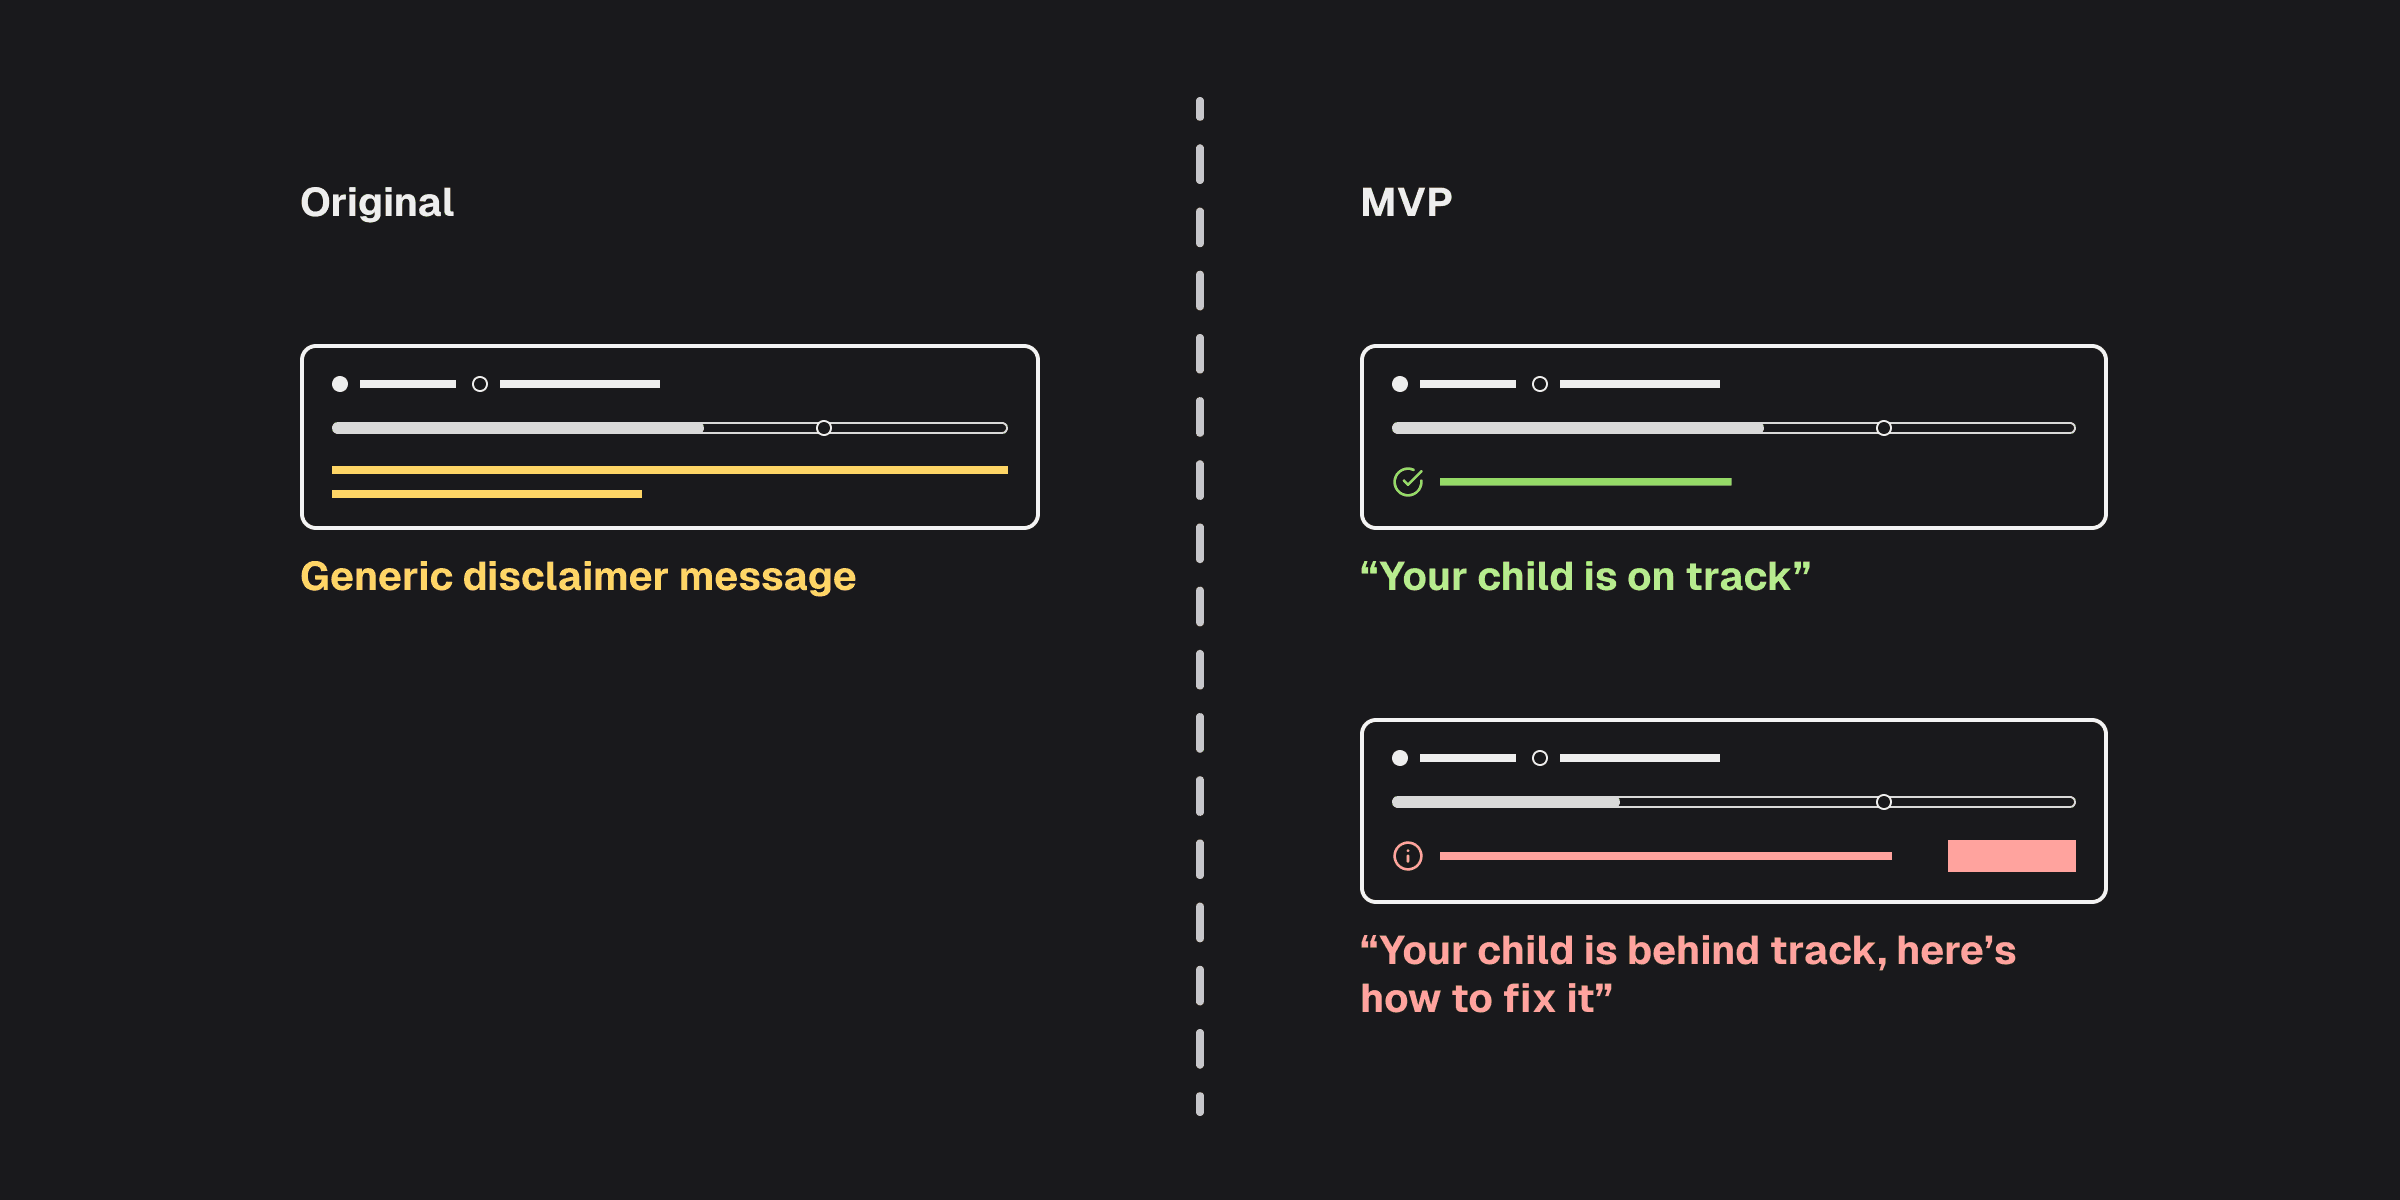
MVP to validate the strategy.
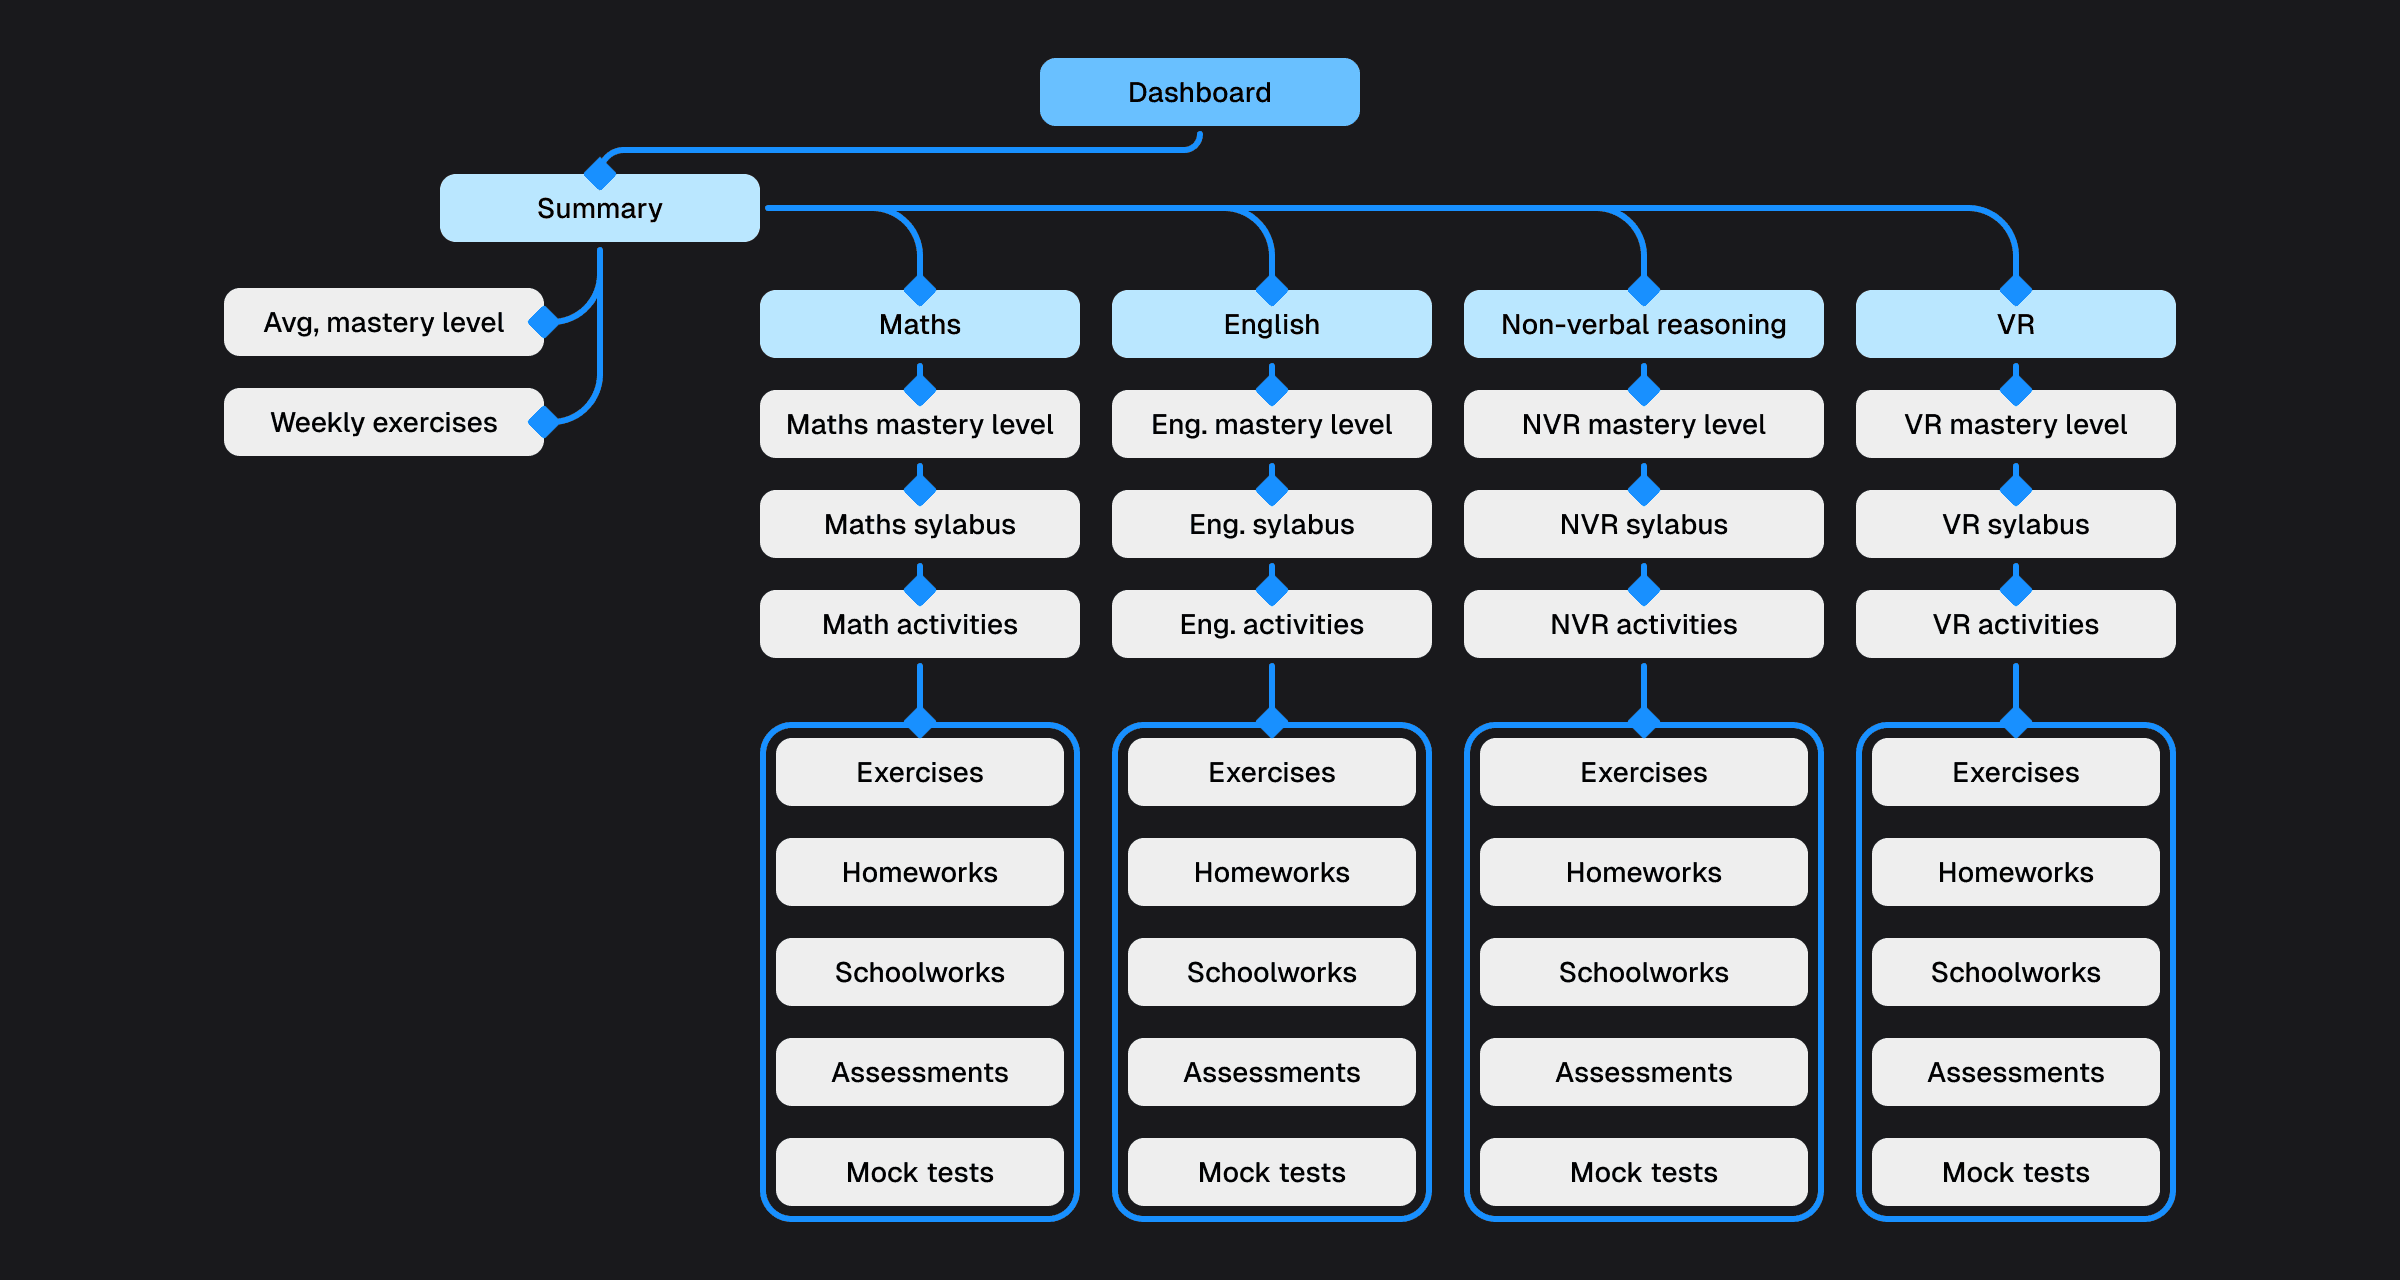
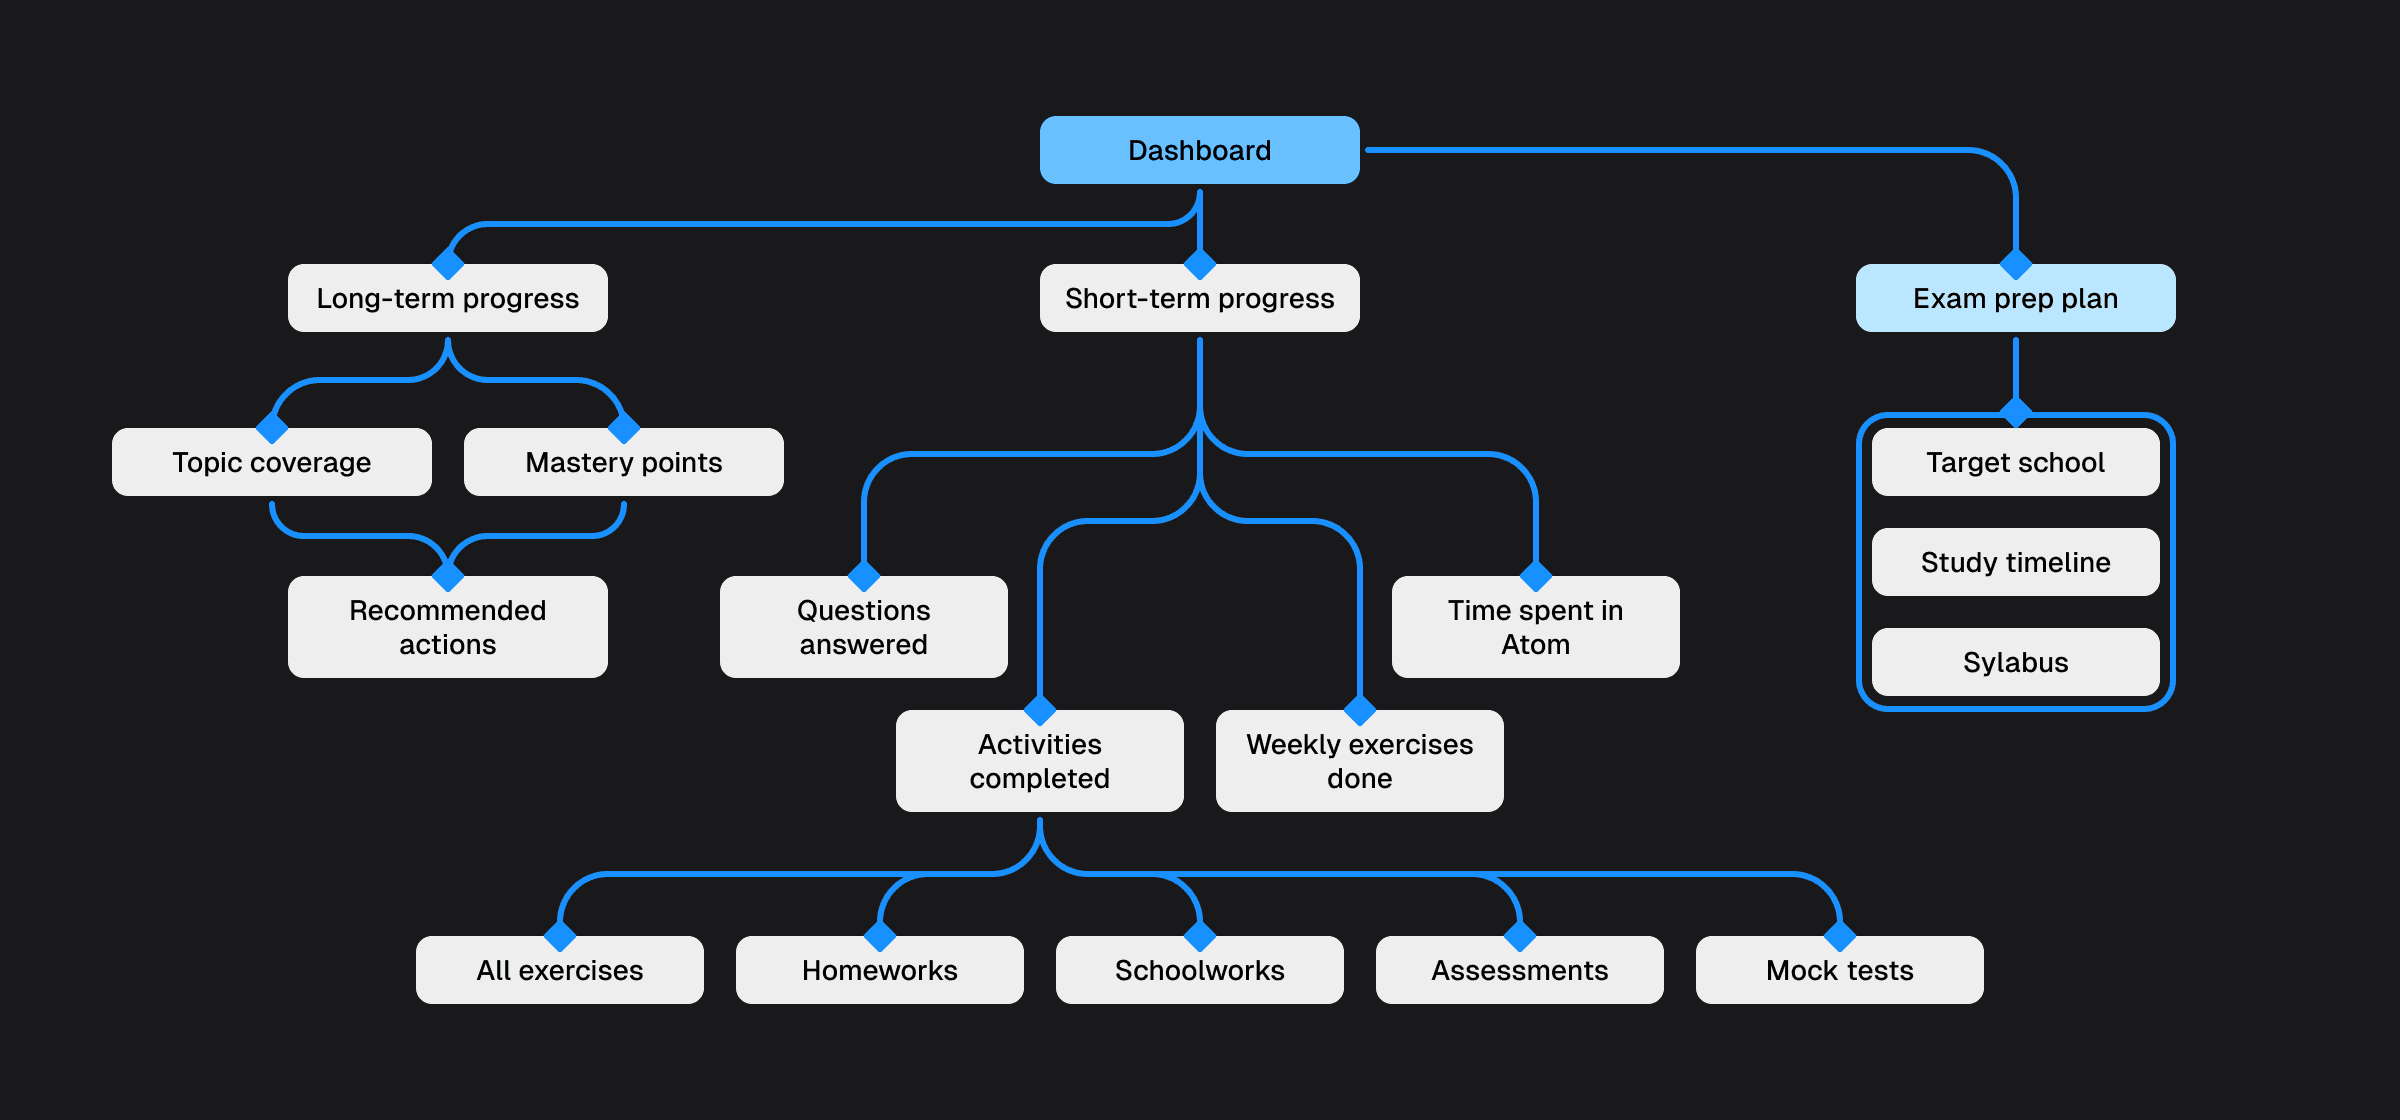
The new dashboard structure.
It's time for the rest of the building blocks:
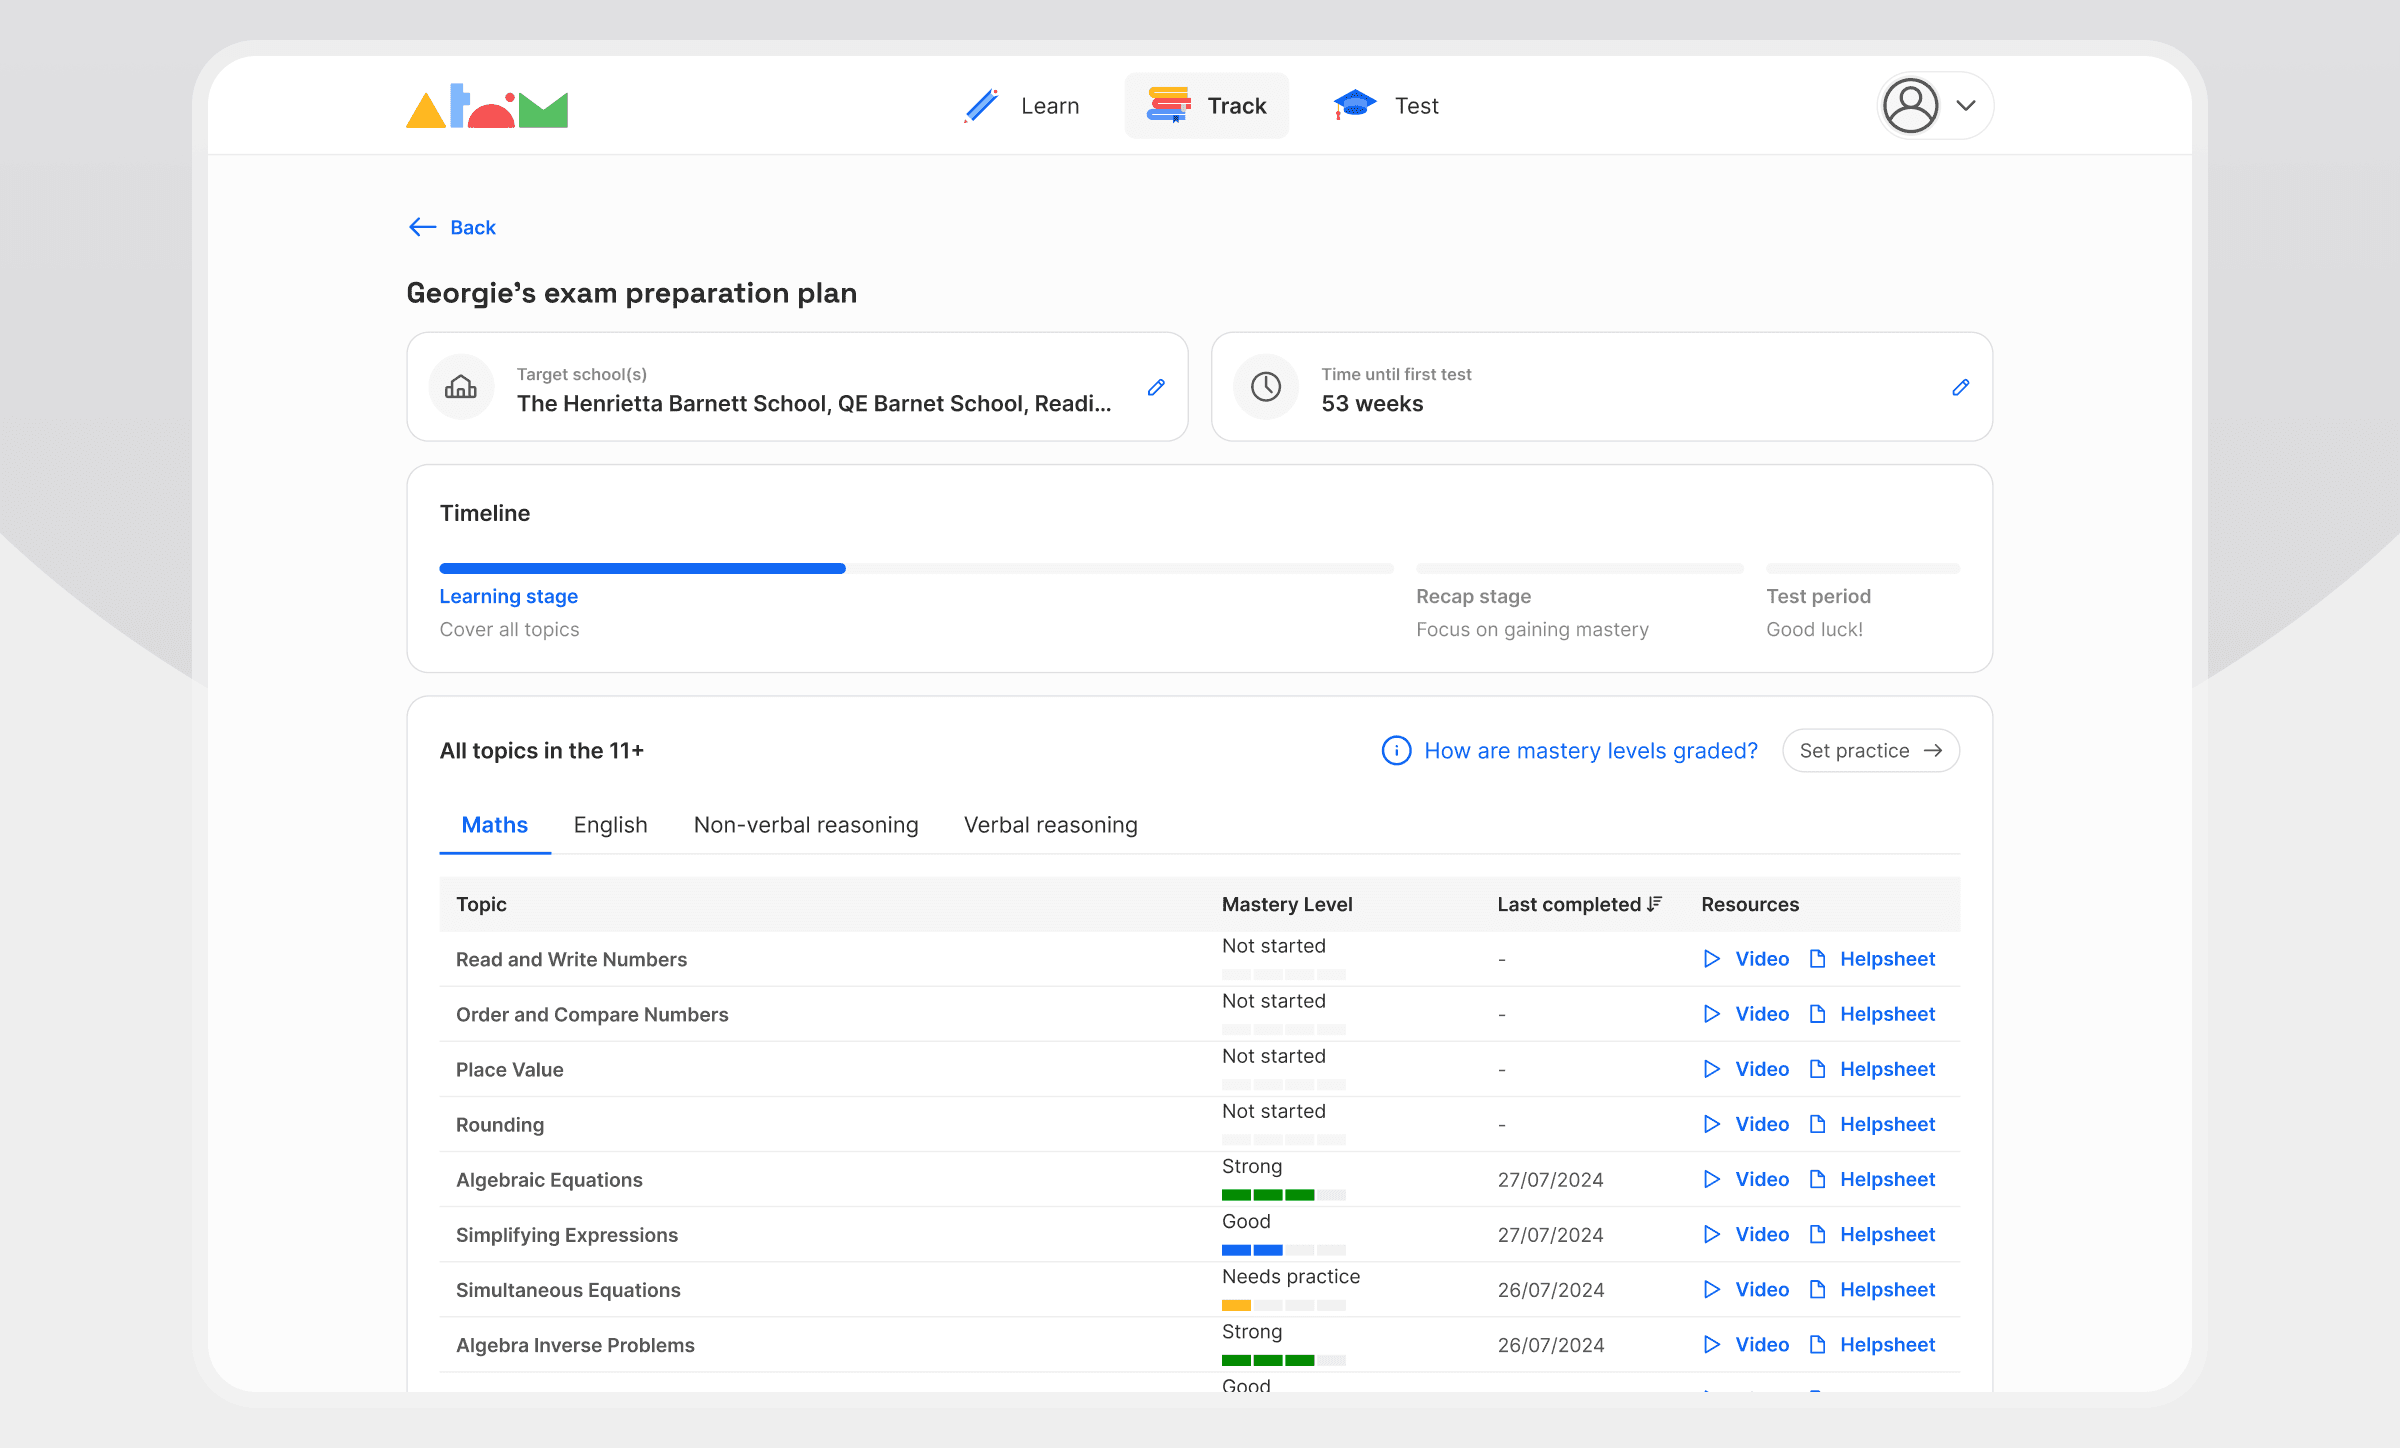
The exam prep plan page
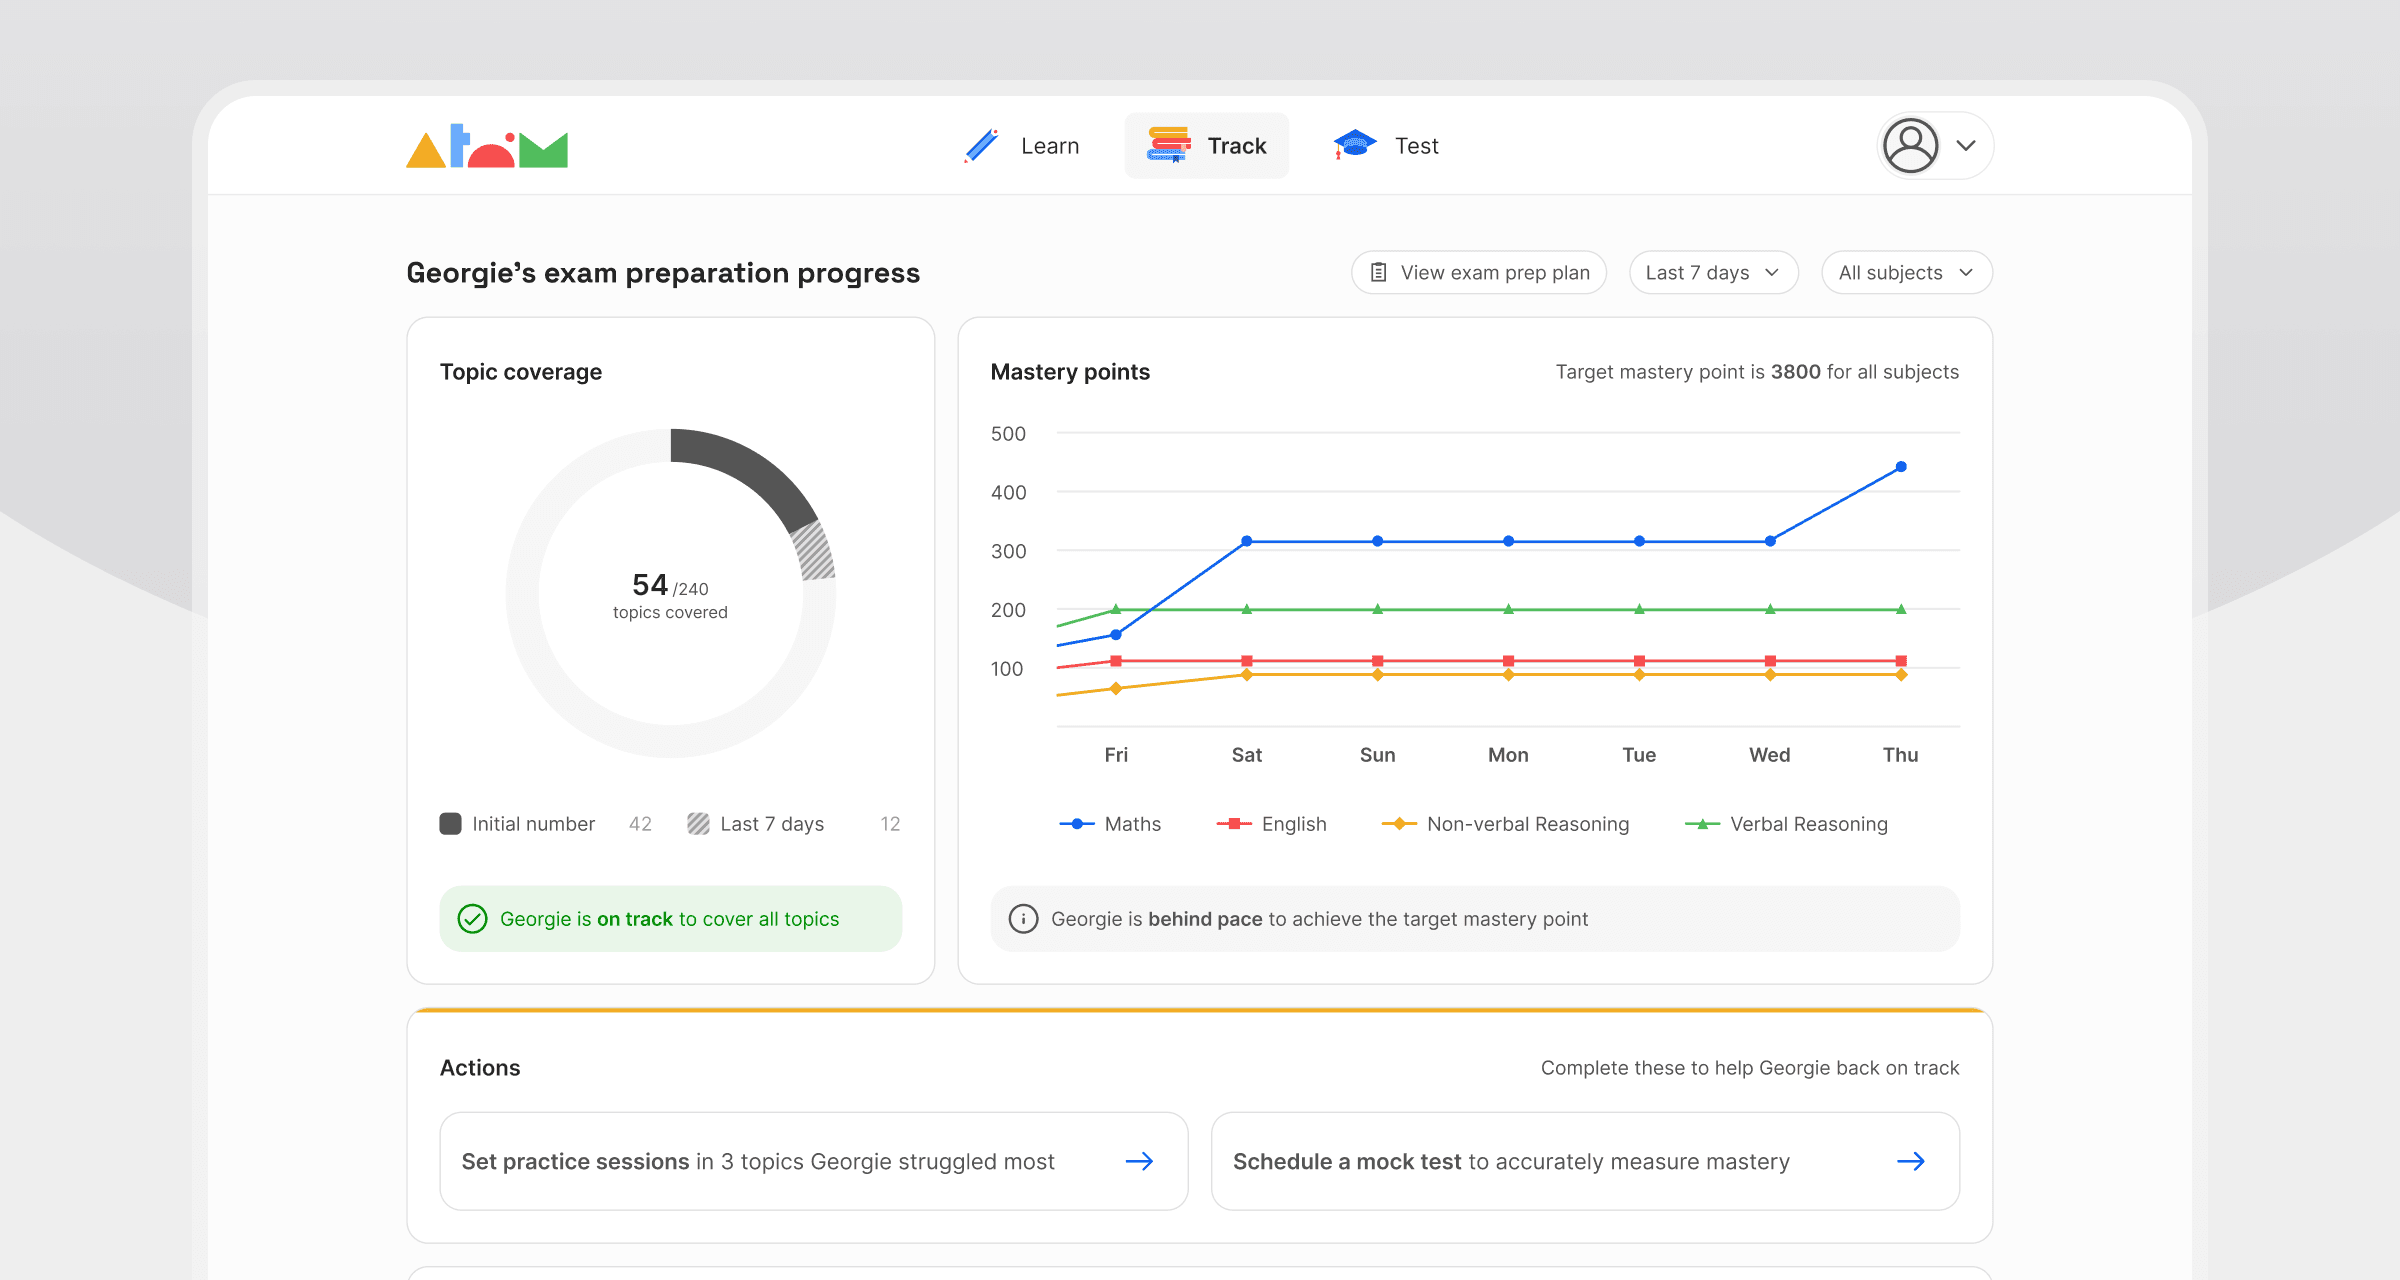
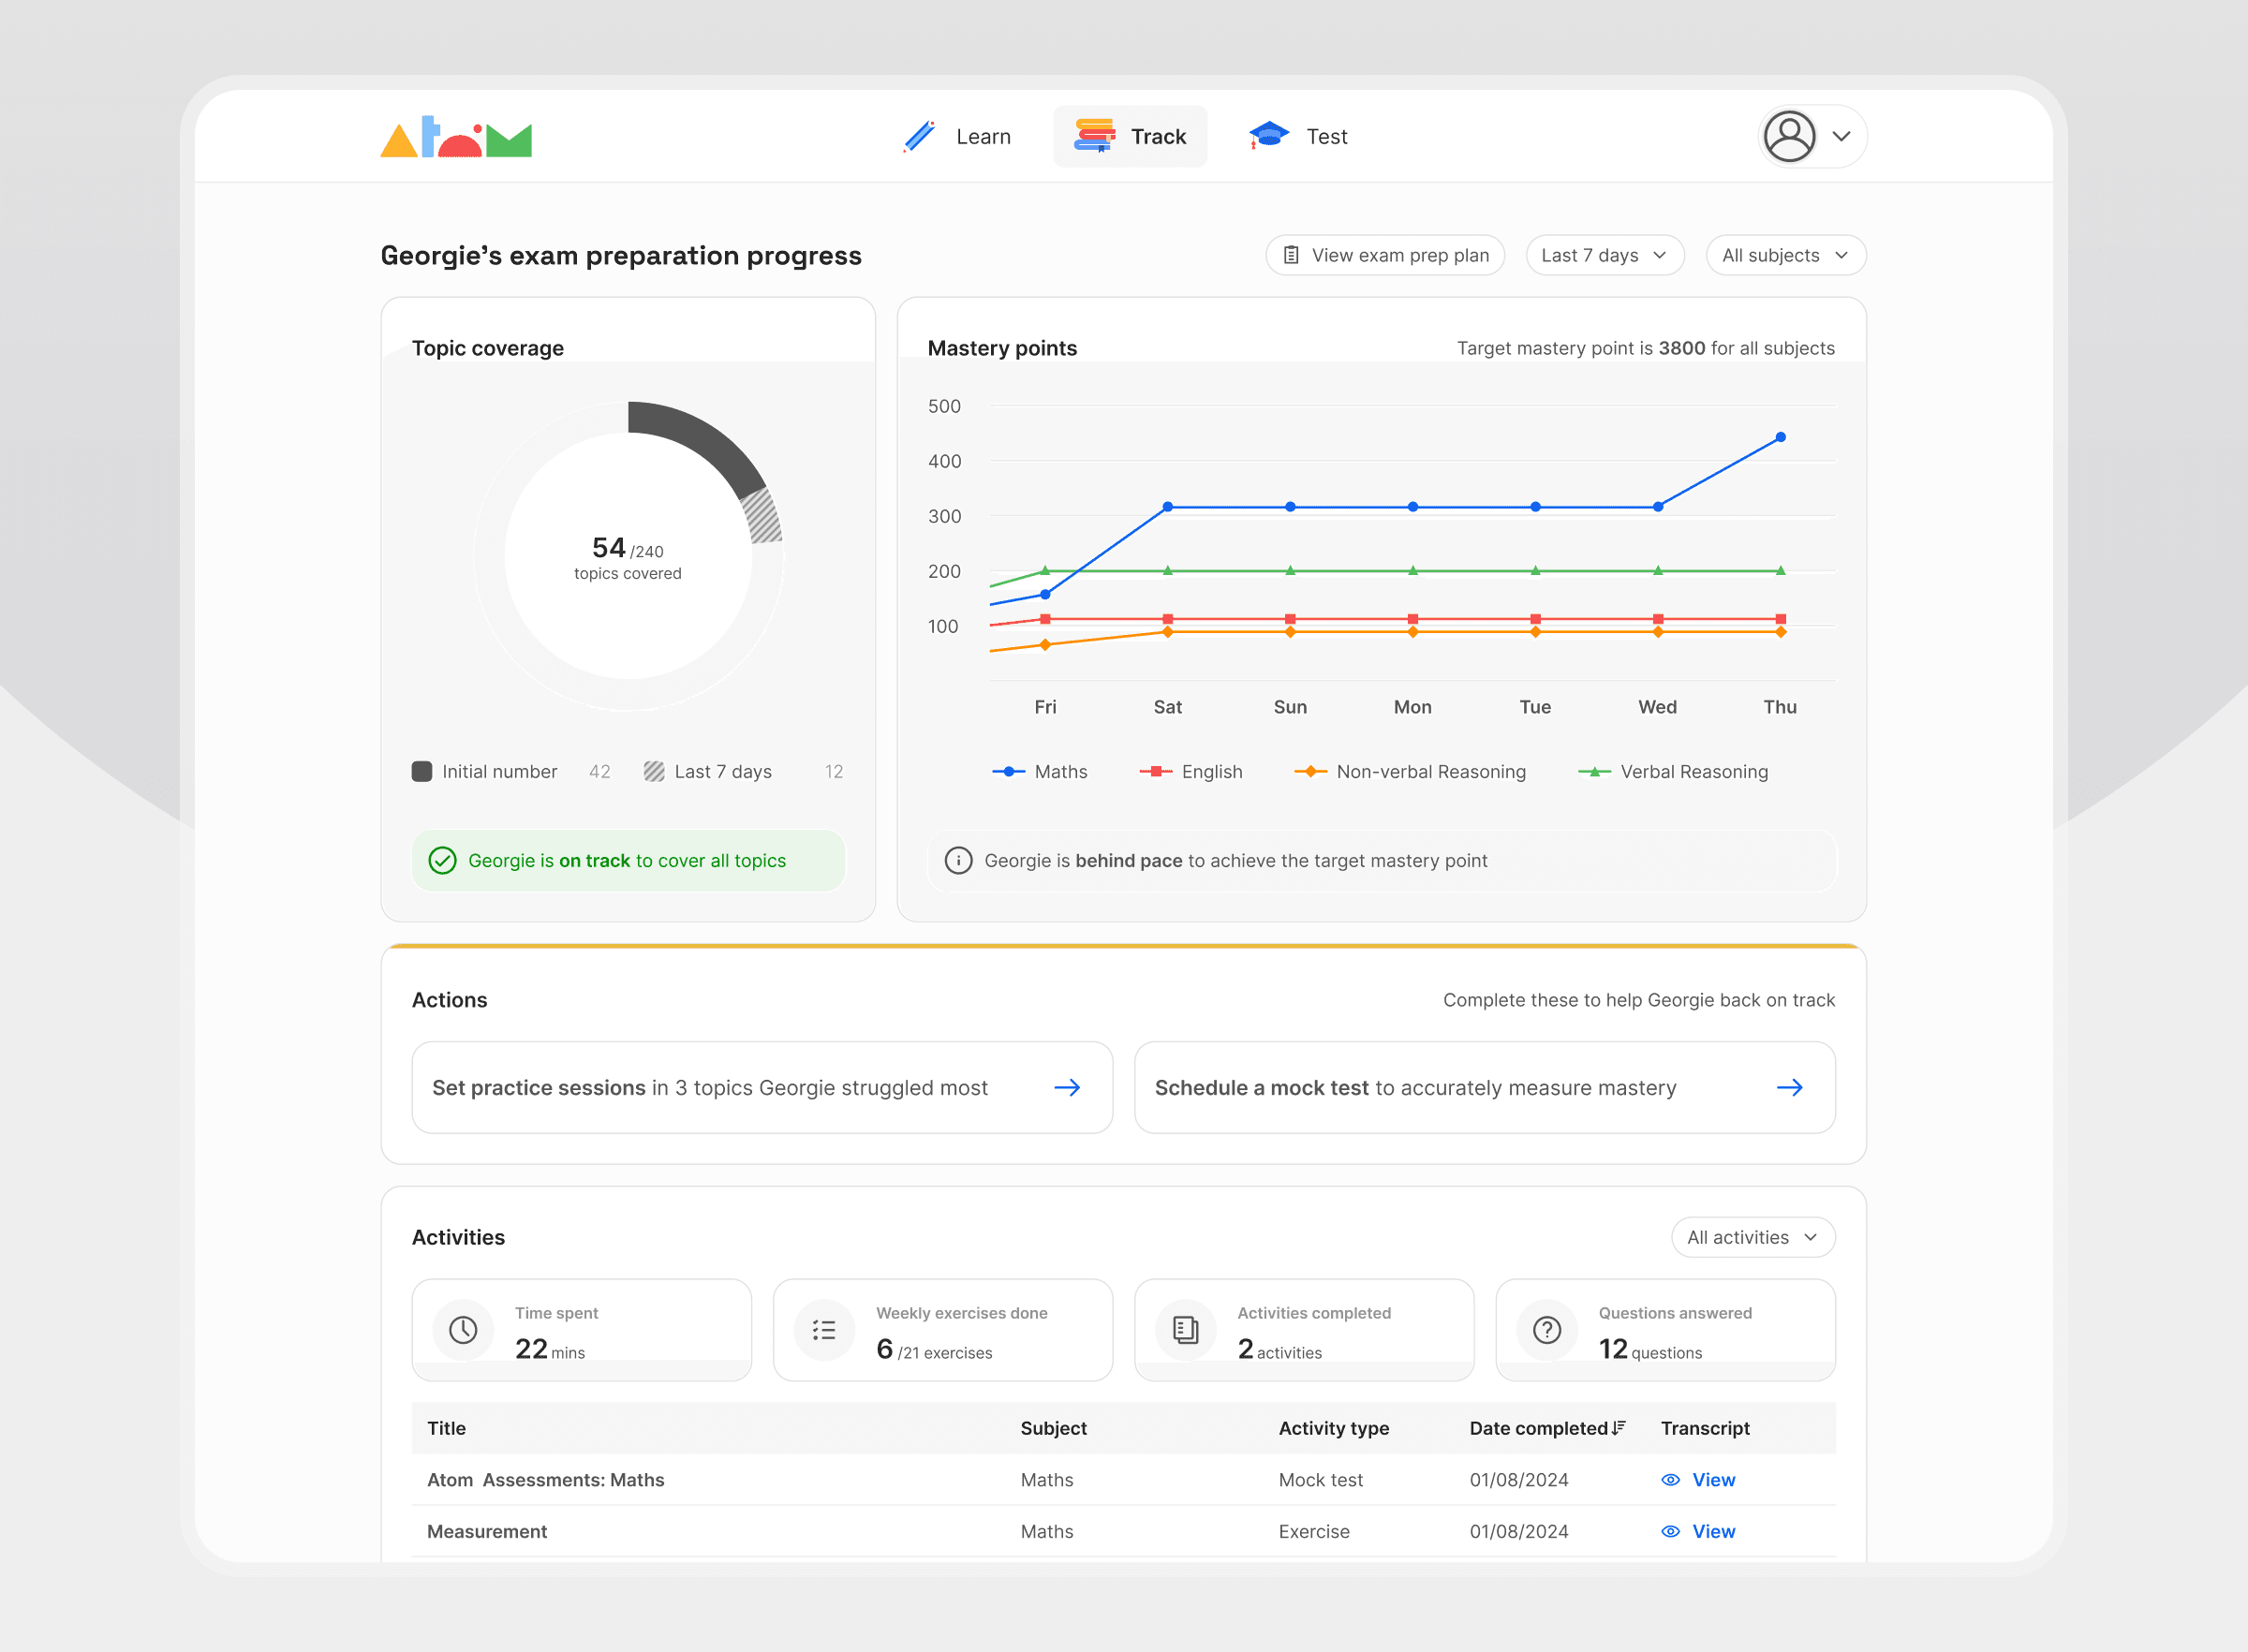
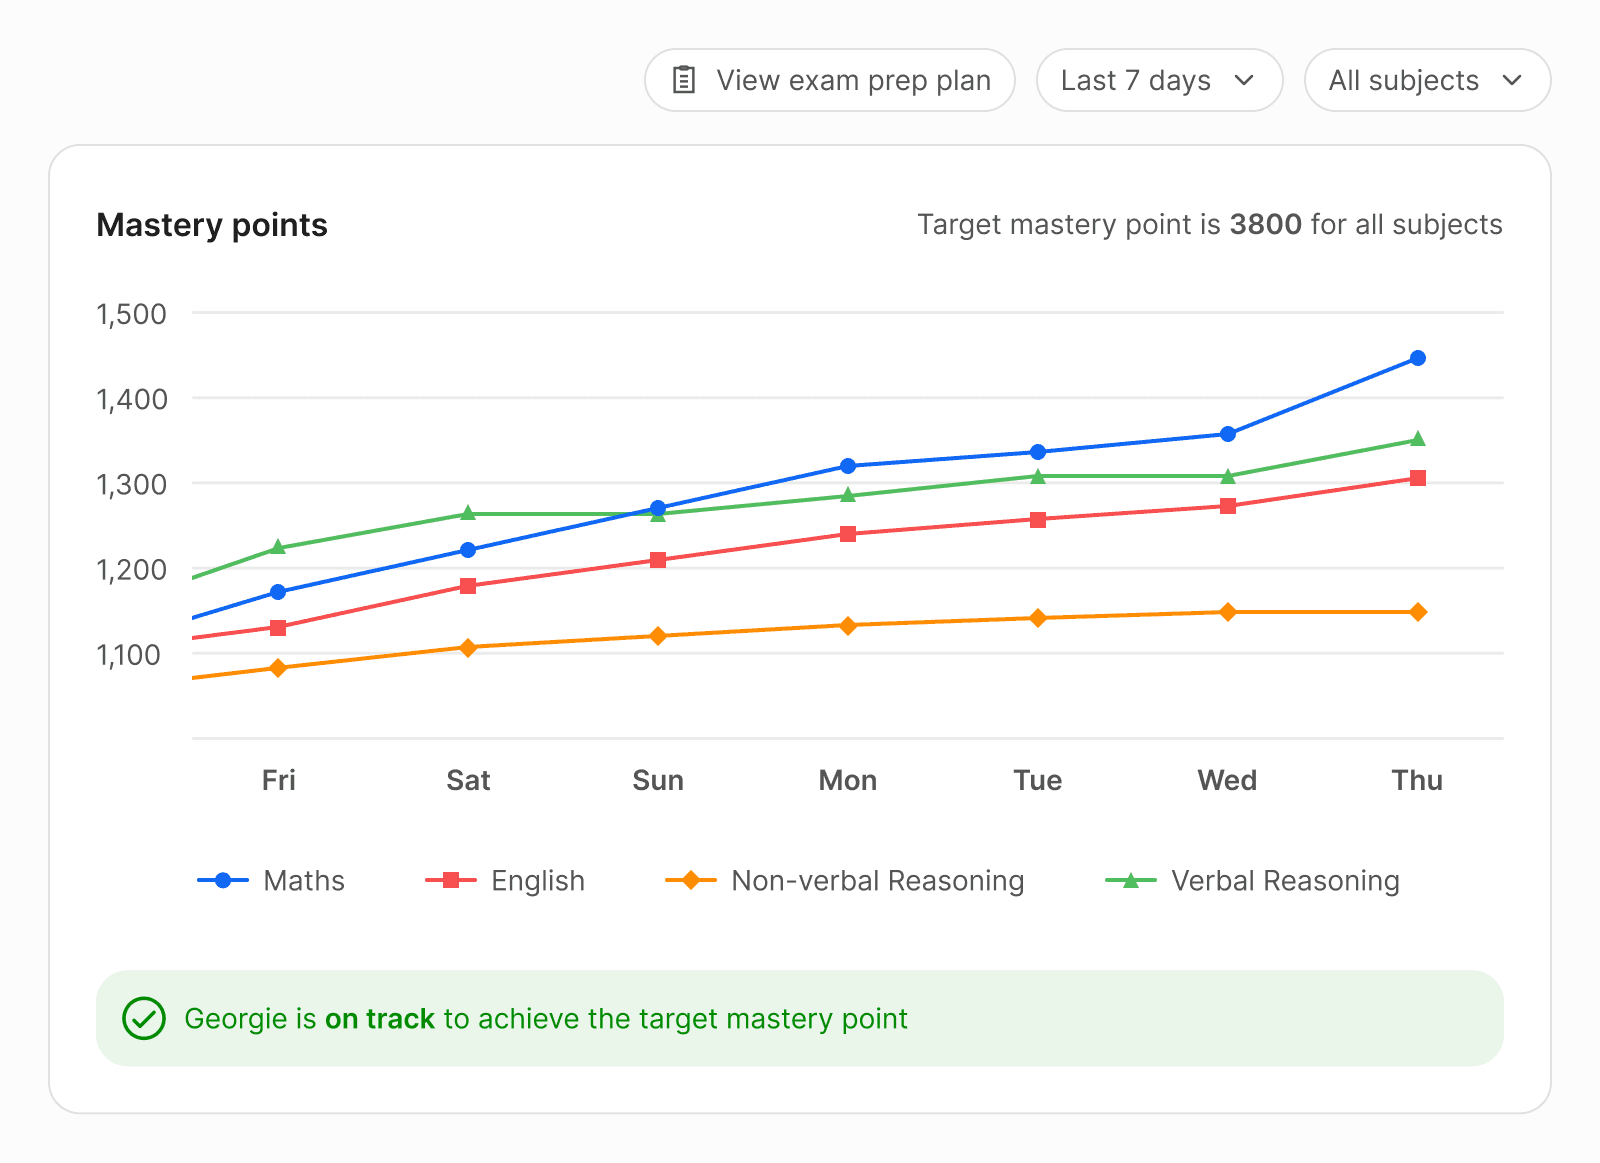
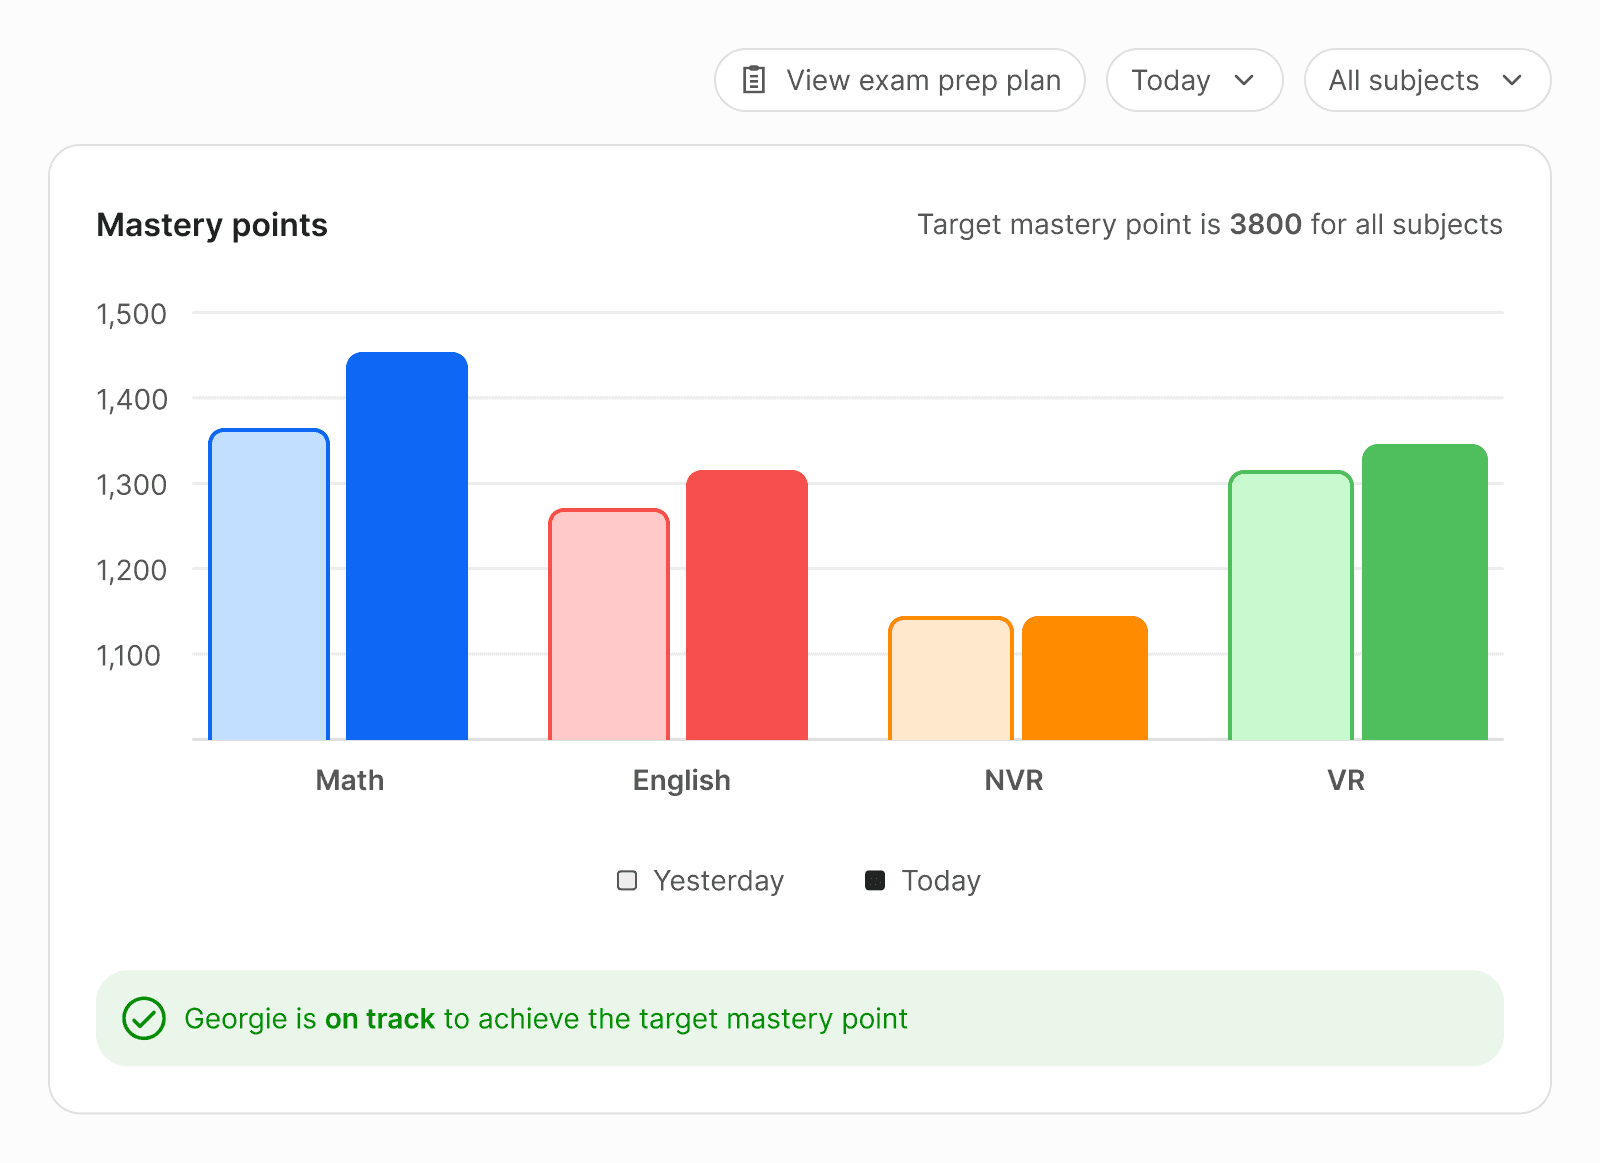
Topic Coverage and Mastery Points
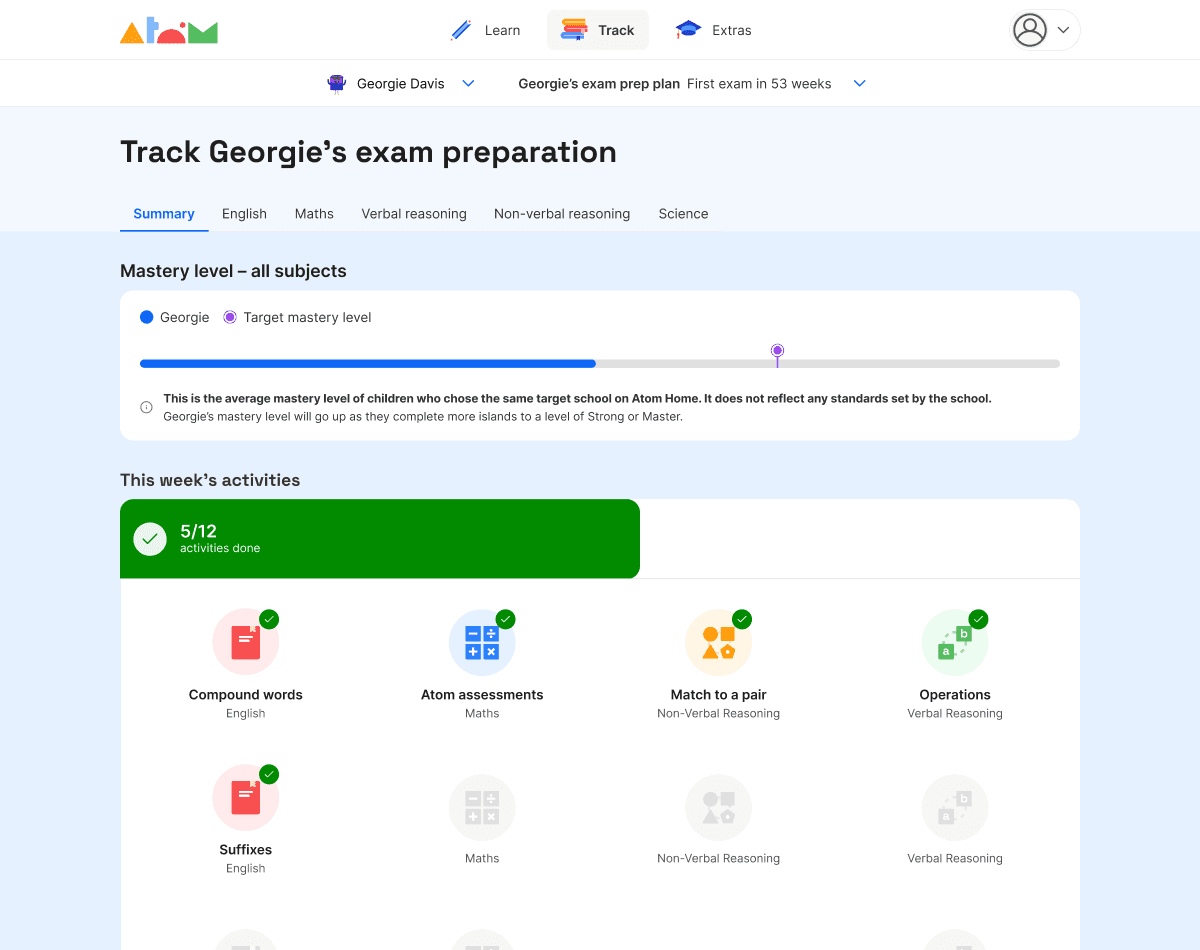
The weekly activities
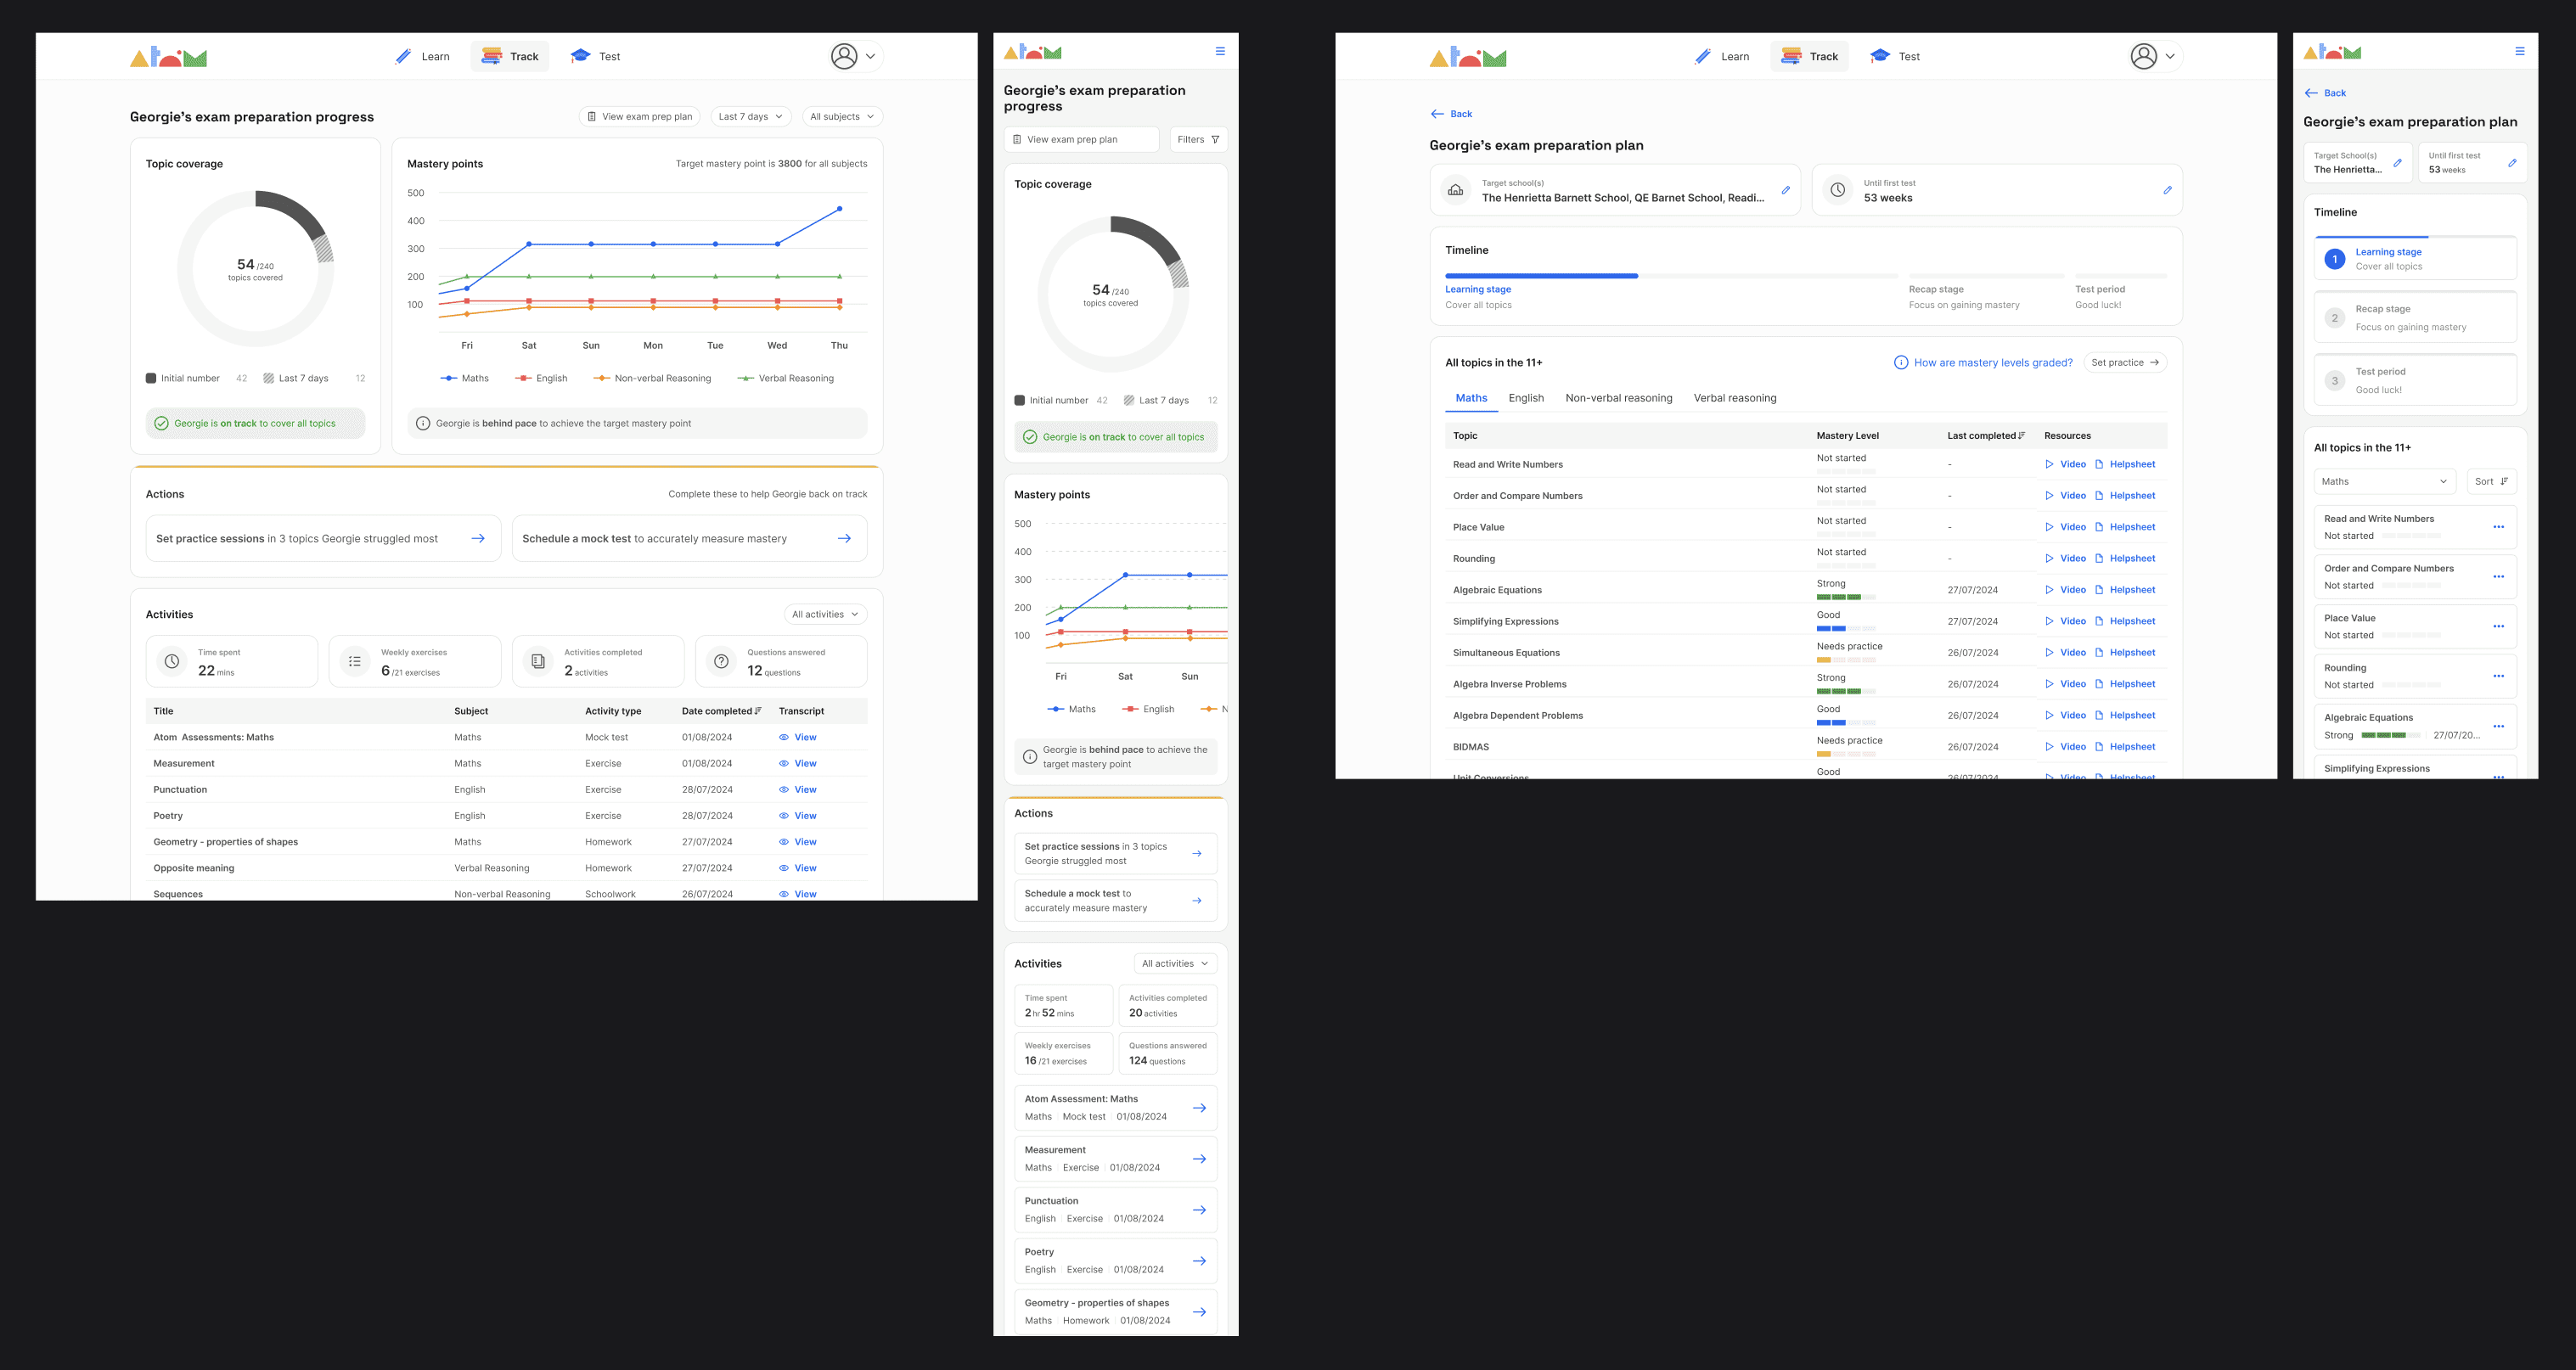
The finished dashboard look.
The exam prep plan, always accessible.
7 days chart (default).
Yesterday and today chart.
Keeping it responsive.
Data tracking.
The bulk of data that were available to us were mostly business metrics as our data engineering team was stretched thin. We had to resort to rely heavily on qualitative feedback from our parent focus groups and past research documentations.
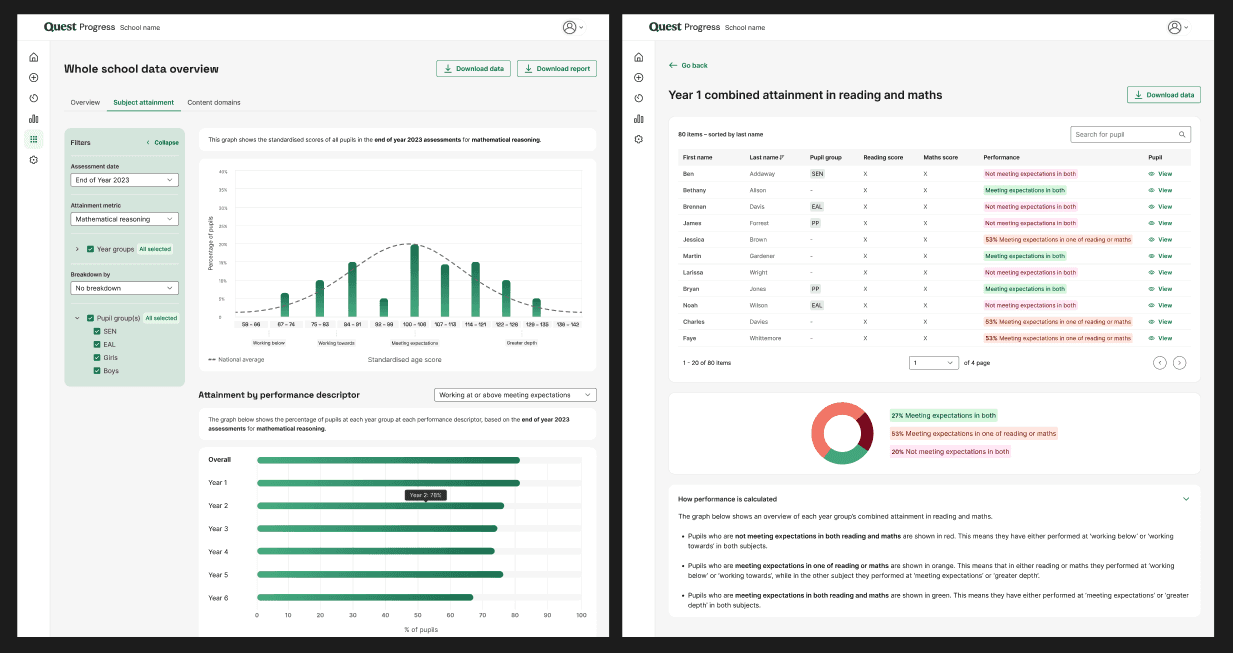
Integration with B2B dashboard for schools.
I worked very closely with our B2B dashboard team to understand our shared constraints and how it would influence the data we could show. (example: our charts were all made with Highcharts modules to expedite the effort)
Our B2B School dashboard.
Fast forward a few months later when I was already working on another project, the lowered number of unsubscriptions contributed to 10% product revenue growth as it were well received among parents in our focus groups. As for the next steps, I would closely monitor these metrics to decide on them.
Short term:
Free trial conversion as users can now see its value
Number of exercises done per student
User retention
Bounce rate
Long term:
Customer Lifetime Value (CLV), as the more parents find the tool useful, the less likely they unsubscribe after their annual subscription expires
Average Topic Coverage and Mastery Points per student
